
All solutions

Satellite monitoring

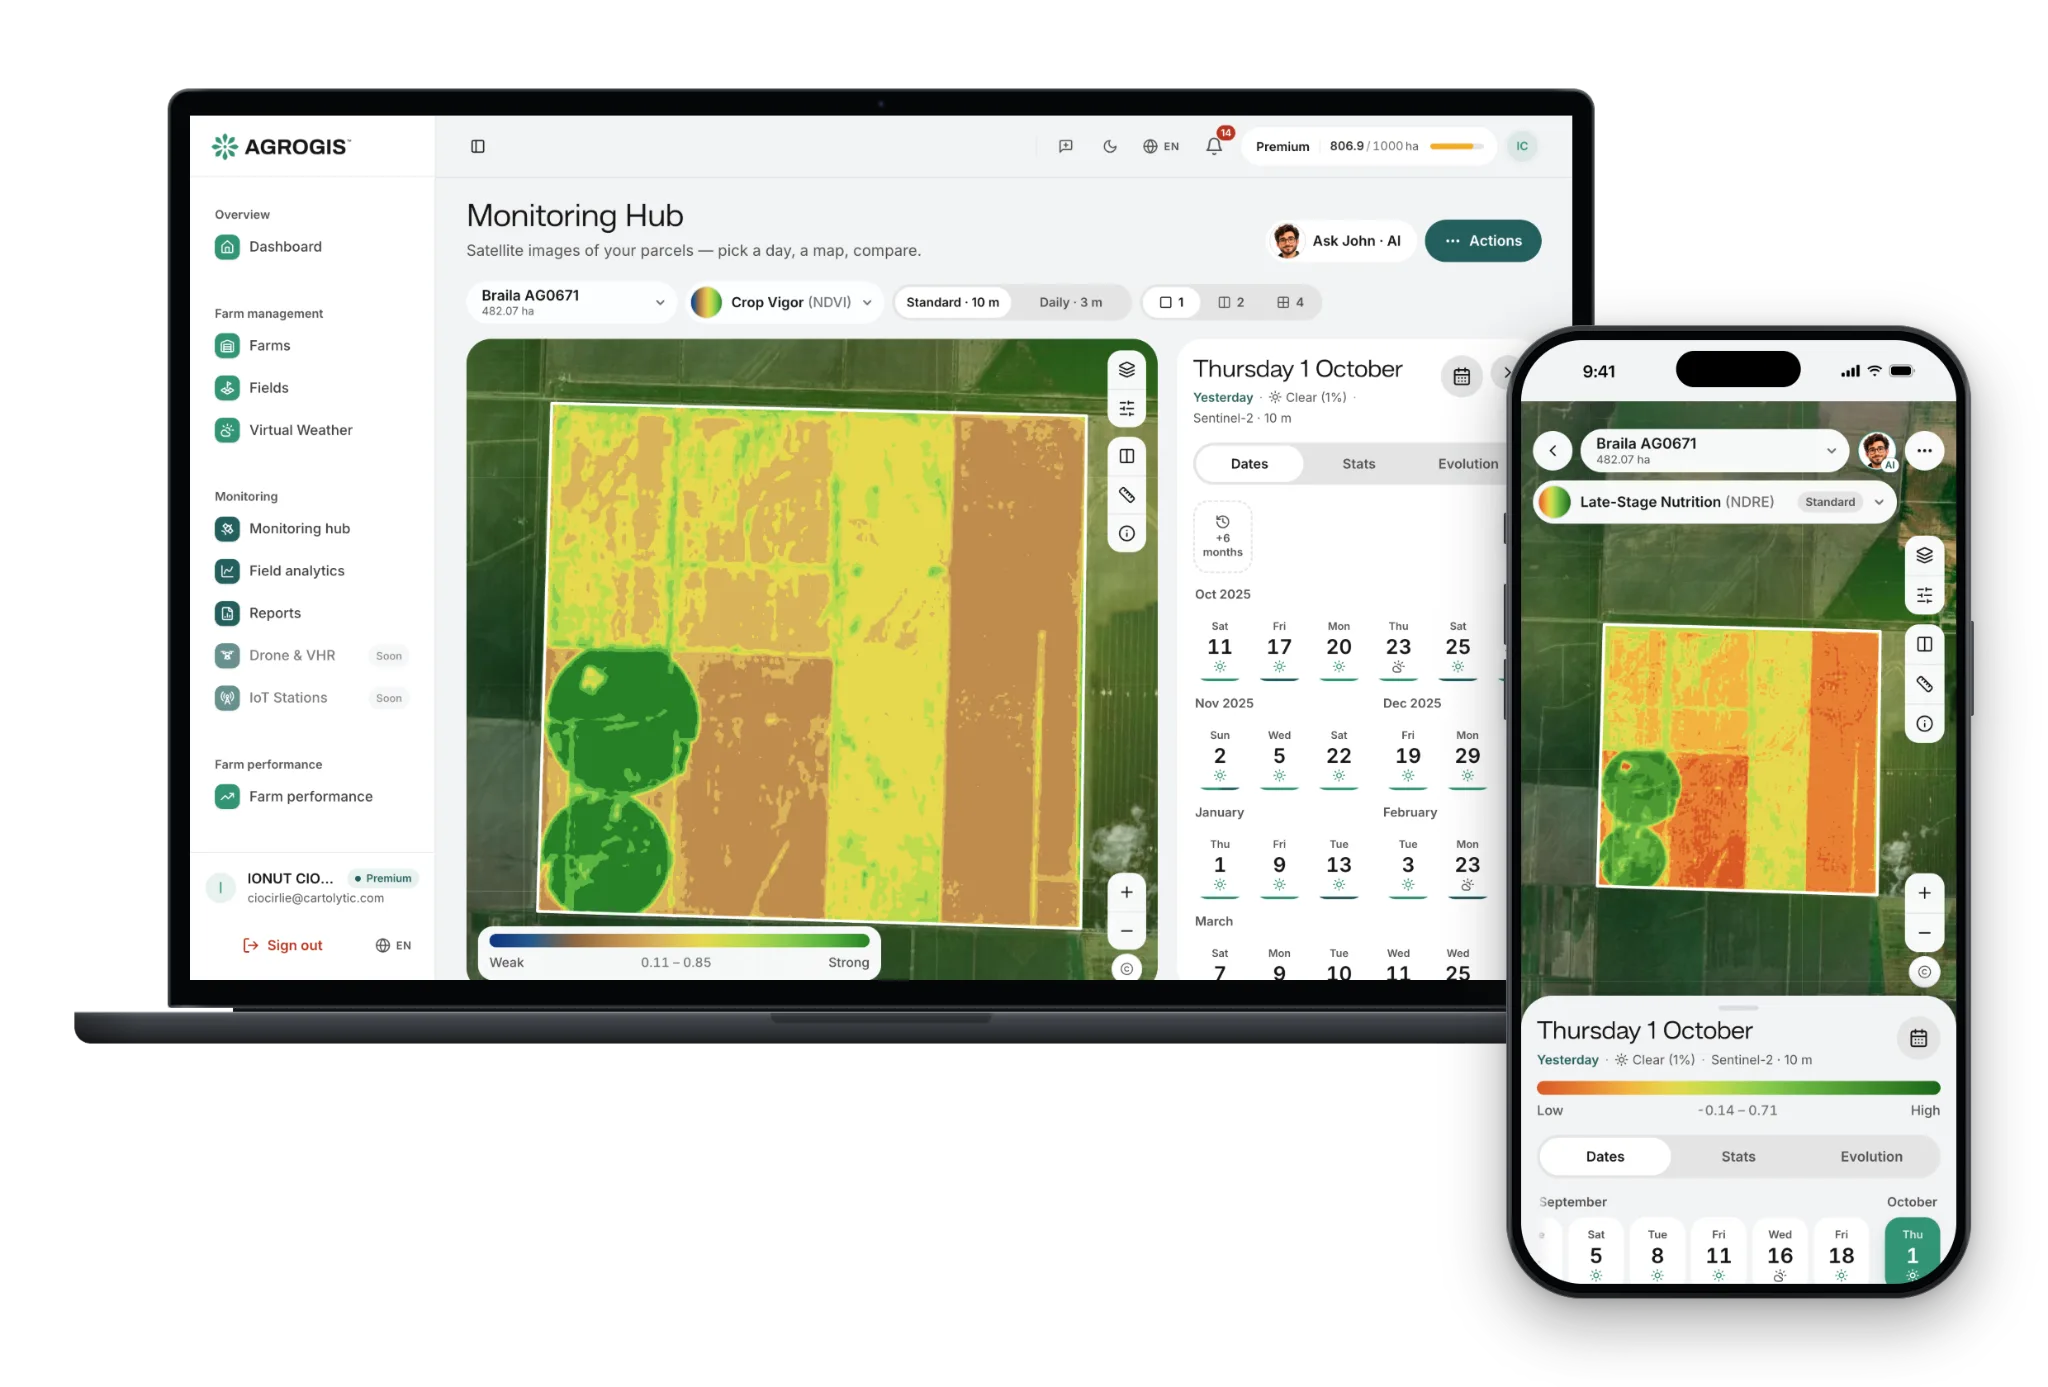
Know what is happening on every parcel without walking it: new images every few days, anywhere in the world.

See where the crop grows well and where it lags, where water sits and what changed since the last pass — without going into the field. A new image every 5 days on every plan; every day with the 3 m module.

Every 5 days
a new 10 m image, on every plan
Daily
3 m images, with the daily module
Anywhere
any parcel in the world, no equipment
Vigour & water
what you see on every parcel, date by date
One season on one farm

What the satellite shows on a real farm

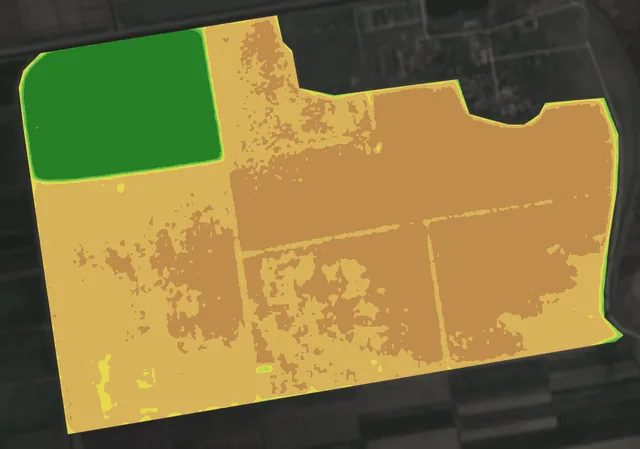
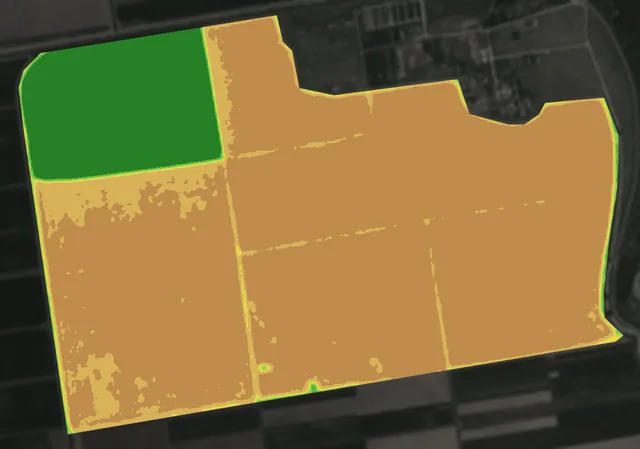
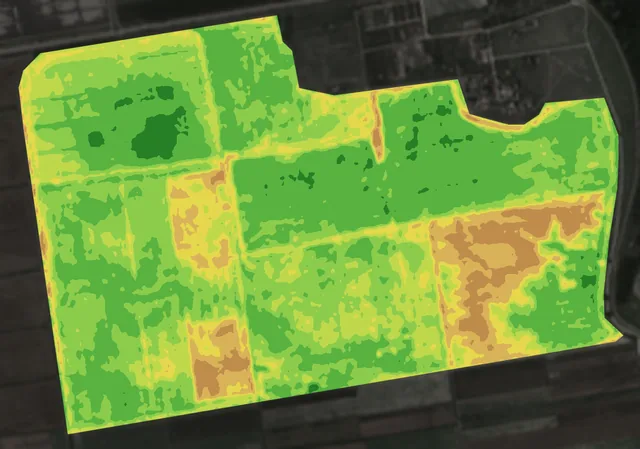
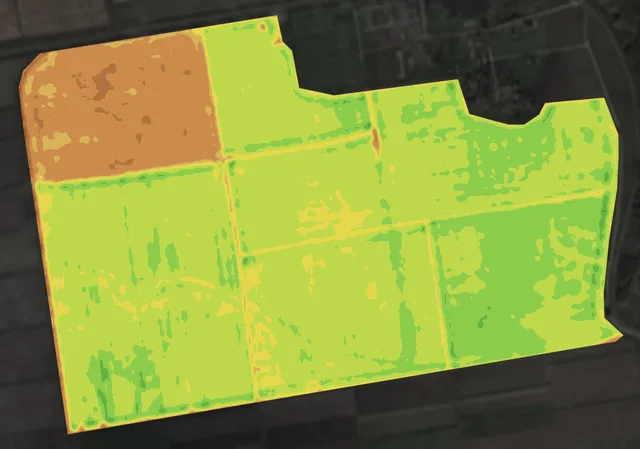
320 hectares, six fields, in the Bărăgan plain (Ialomița), 2025: what the farmer could learn without walking every field. Scroll: the map changes at every step.

  1. 1

    The whole season, field by field

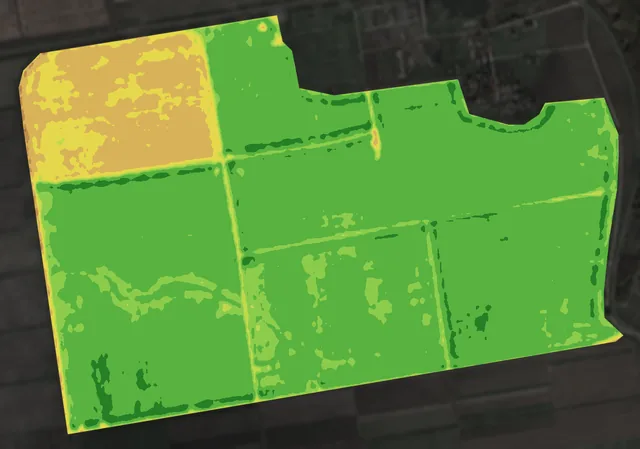
    From March to November 2025 the satellite saw the farm 60 times without cloud. Each band is one field: green while the crop is growing.

    Field A, a winter crop, was green from March and harvested in mid-June. B–F, spring crops, came up between late May and early June, were growing hardest in mid-June and dried out in July. By November the new crop was already up.

    What you do: See at a glance what stage each field is at, and what has changed since the last pass.

    bare soildense crop
  2. 2

    Know which field to visit first

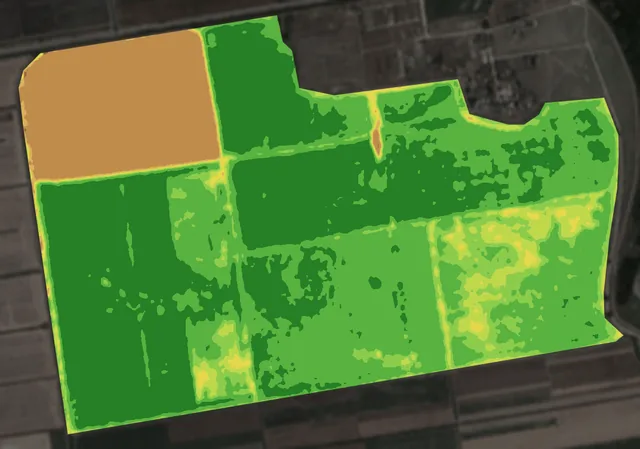
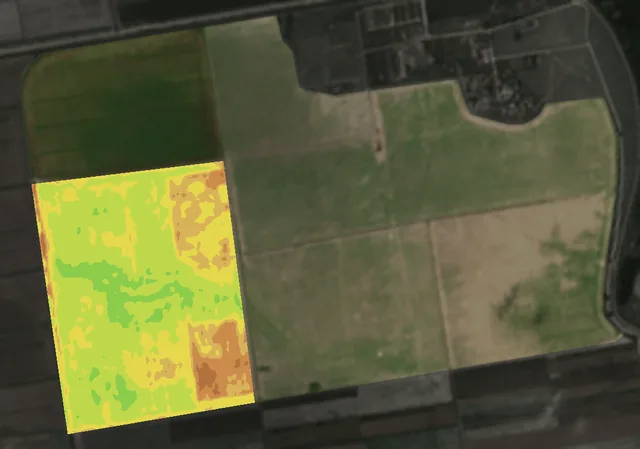
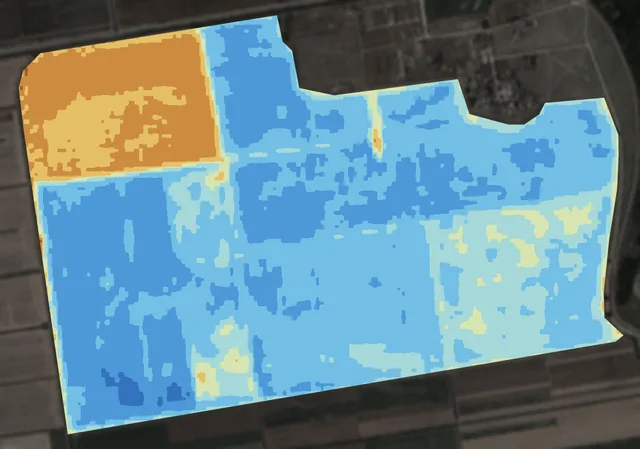
    On 18 June, field F was clearly behind.

    It came up about 5 days after the others and, at its best, had roughly a quarter less crop than B, C, D and E.

    What you do: Go first where the map shows a problem, not across all 320 hectares.

    bare soildense crop
  3. 3

    See where in the field the problem is — and since when

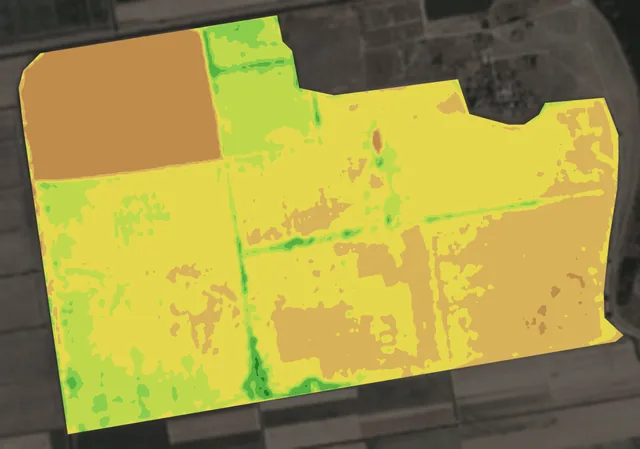
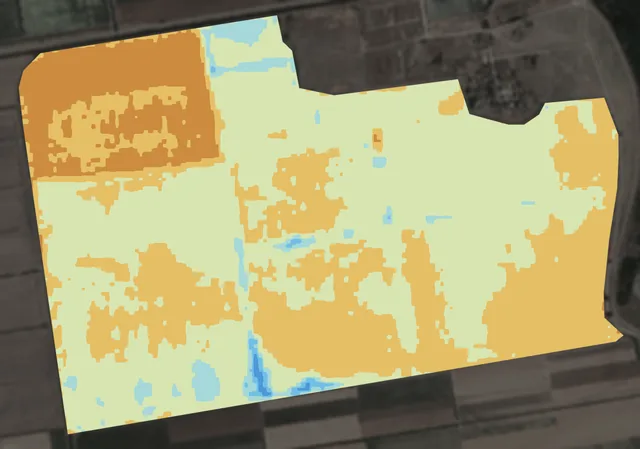
    In field D, 15 ha (nearly a fifth of the field) grew a quarter weaker in the second half of June.

    Much of that same ground had barely come up on 2 June: the problem started at emergence, not in June.

    What you do: Check on the ground what happened there (sowing, soil, water). Then, with the zone map, give each zone its own rate and send it to the tractor’s terminal.

    bare soildense crop
  4. 4

    Watch the drought reach each field

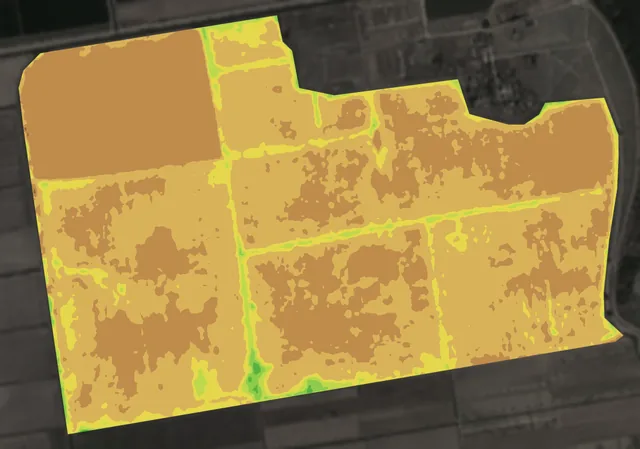
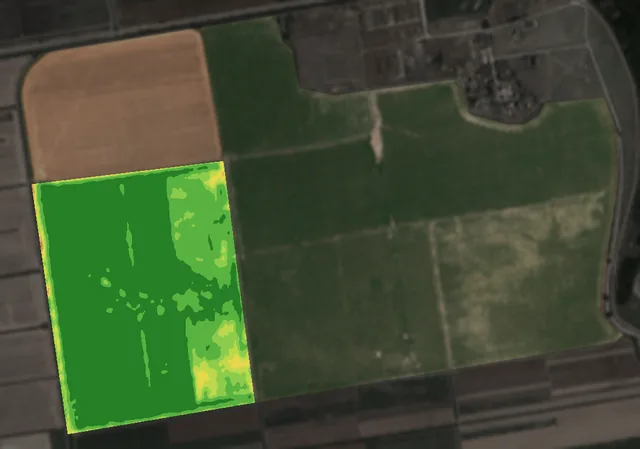
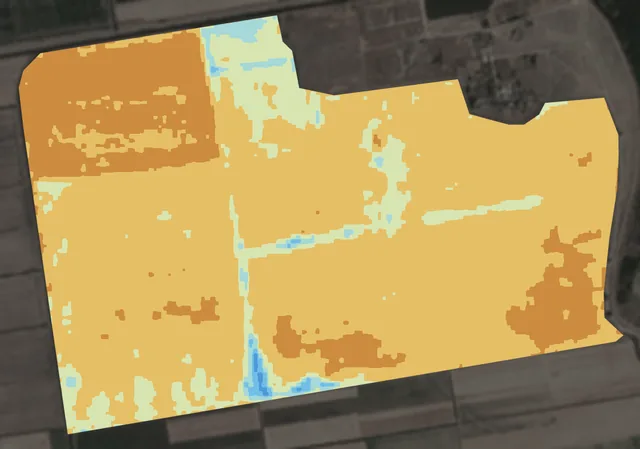
    Fields E and F went into water stress on 2 July, C and D on 12 July, and B only on 1 August.

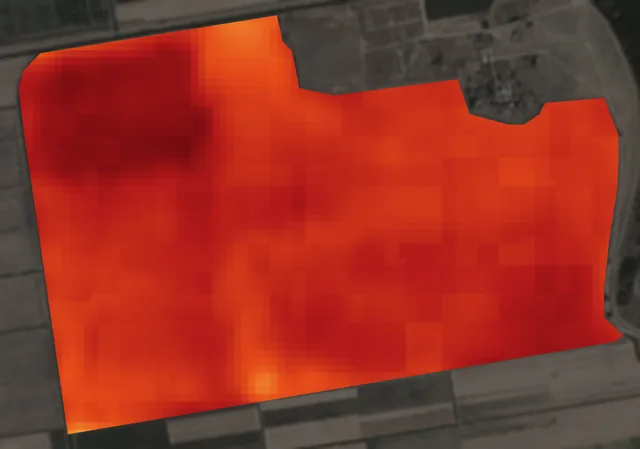
    Field B held its water three to four weeks longer than its neighbours: on 14 July, a heatwave day, it was 1–2 °C cooler (Landsat), and on 4 August it was still greener than the rest.

    What you do: Know where and when the drought hits: what to irrigate first, if you can irrigate, and which fields hold out better — you can treat them differently.

    severe stressenough water
  5. 5

    Check the autumn crop came up, without walking the fields

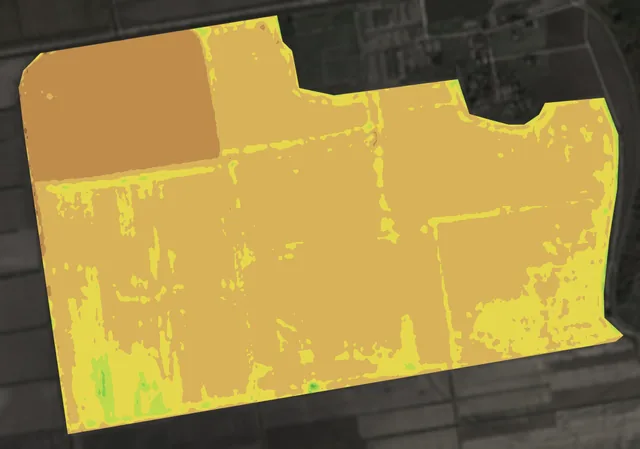
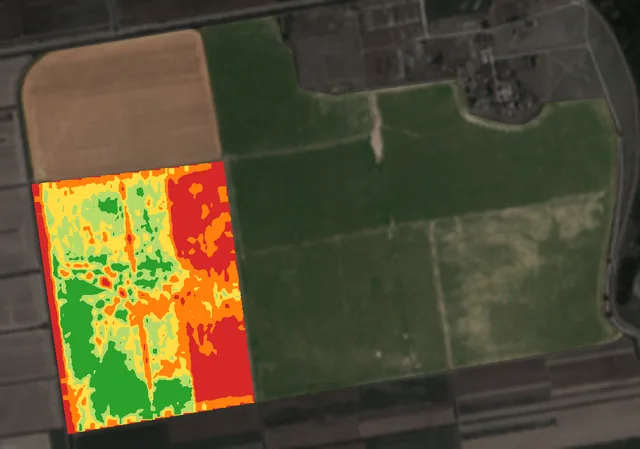
    On 5 November the new crop had come up evenly on B–F: under 1 ha of gaps across nearly 280 ha.

    On field A it was only just coming up.

    What you do: Know in time whether, and where, you need to re-sow.

    not up yetstrong emergence

Maps from 2025 Sentinel-2 and Landsat 9 images, in the same colours as in the app; for temperature the colours are spread over 40–56 °C so a heatwave day still shows differences. Contains modified Copernicus Sentinel data 2025. Landsat: USGS.

John · AI assistant

Not sure what a map is telling you? Ask John.

The maps above, for your own parcels, with an AI assistant to read them with you at any hour: what changed since the last clear image, which parcel changed most, and what to check when you get there.

  • Explains your maps

    Ask why a parcel changed. John reads its satellite history date by date, always comparing images from the same satellite, and tells you in plain words what moved and what to check in the field.

  • Helps you plan the work

    It reads your open issues and recent jobs, and the forecast for your farm on Premium or with the weather add-on, to help you choose when to scout, spray or irrigate.

  • 24/7, in your language

    Day or night, weekends included, in Romanian, English, Italian, Spanish or French. John answers your own questions on the paid plans — Basic, Premium and Enterprise; during the free trial it shows example questions and answers.

John is an AI, not a person. It asks for your consent before it reads your data, only reads it and changes nothing in your account, recommends no products, gives no doses for plant-protection products or fertilisers, and can be wrong — the decision is always yours, so check anything important with an agronomist or our support team.

John · AI assistant24/7

Which parcel should I walk first this week?

Parcel E. Since the last clear image, on 12 July, its crop vigour dropped the most of your six parcels, and its water-stress map moved the same way. C and D are steady. Start with E and check the soil at root depth.

  • Crop Vigor · 6 parcels
  • Water Stress · Parcel E
An example conversation

What you get

Everything you need to make field decisions based on data — not assumptions. Features included in this solution:

  • / 01

    See where the crop grows well and where it lags, on a colour map

  • / 02

    Find the zones where plants lack water, or where water sits

  • / 03

    Put different dates side by side and see what changed since the last pass

  • / 04

    Get a notification in the app when a new image arrives on your parcels

  • / 05

    Works for any parcel in the world, with no sensors or equipment

  • / 06

    Download a PDF report with the maps and values, for your records

How it works

How it works, step by step, from the first message to the result.

  1. 1

    Add your field on the map

    Draw the boundary, tap the parcel for a suggested outline, or import GeoJSON, KML or KMZ.

  2. 2

    First images shortly after you add the field

    AGROGIS picks the clear-enough images and calculates the indices for you.

  3. 3

    Get told when new imagery lands

    The app notifies you when a new satellite pass reaches your parcels, and you compare it with earlier dates. It does not raise automatic crop-stress alerts.

Technical details

For anyone who wants the exact numbers: sources, frequency, formats. For anything else, write to us.

Resolution
10 m and 30 m included; 3 m with the daily high-detail add-on
Frequency
A new image every 5 days, the 30 m one every 16, daily with the add-on
Indices
6 indices on the included imagery (NDVI, NDRE, NDMI, NDWI, MSAVI, EVI) and surface temperature (LST); GNDVI, EVI2 and true colour with the daily add-on
Coverage
Global — any field anywhere
Export
PDF
Cost
Included in your AGROGIS subscription

Frequently asked

  • How often do I see a new image?
    Sentinel-2 passes every 5 days, and the wider 30 m view every 16. Only scenes clear enough to read are used, so in a cloudy spell the gap between usable images grows until the next clear pass.
  • How is this different from free satellite imagery I could download myself?
    We pull each new pass for your parcel, set aside scenes that are too cloudy, and compute the indices on your exact field boundary — you don't download, process or reproject anything. You get a notification when new imagery lands; reading what changed stays with you, date against date.
  • Can I export what I see for my own records?
    The monitoring view exports a PDF report with the maps and index readings for the dates you pick — that is the export it offers today. We do not file anything with a paying agency on your behalf, and there is no automatic subsidy submission.
  • Does it work on small fields too?
    The included imagery has 10 m pixels, so on fields under 1 ha the resolution is limited. For small fields we recommend pairing with drone flights (see /solutions/drone).

Ready to start?

Try it on your own parcels, or tell us what you need — we reply within one business day.