
Stop driving out to look

Check every parcel from the kitchen table. Drive out only where something changed.
Eight modules on the same parcel record: fields, satellite imagery, season curves, EUDR/ISCC reports, prescription maps, jobs and treatments, costs and field guidance. Works in the browser and installs on your phone.
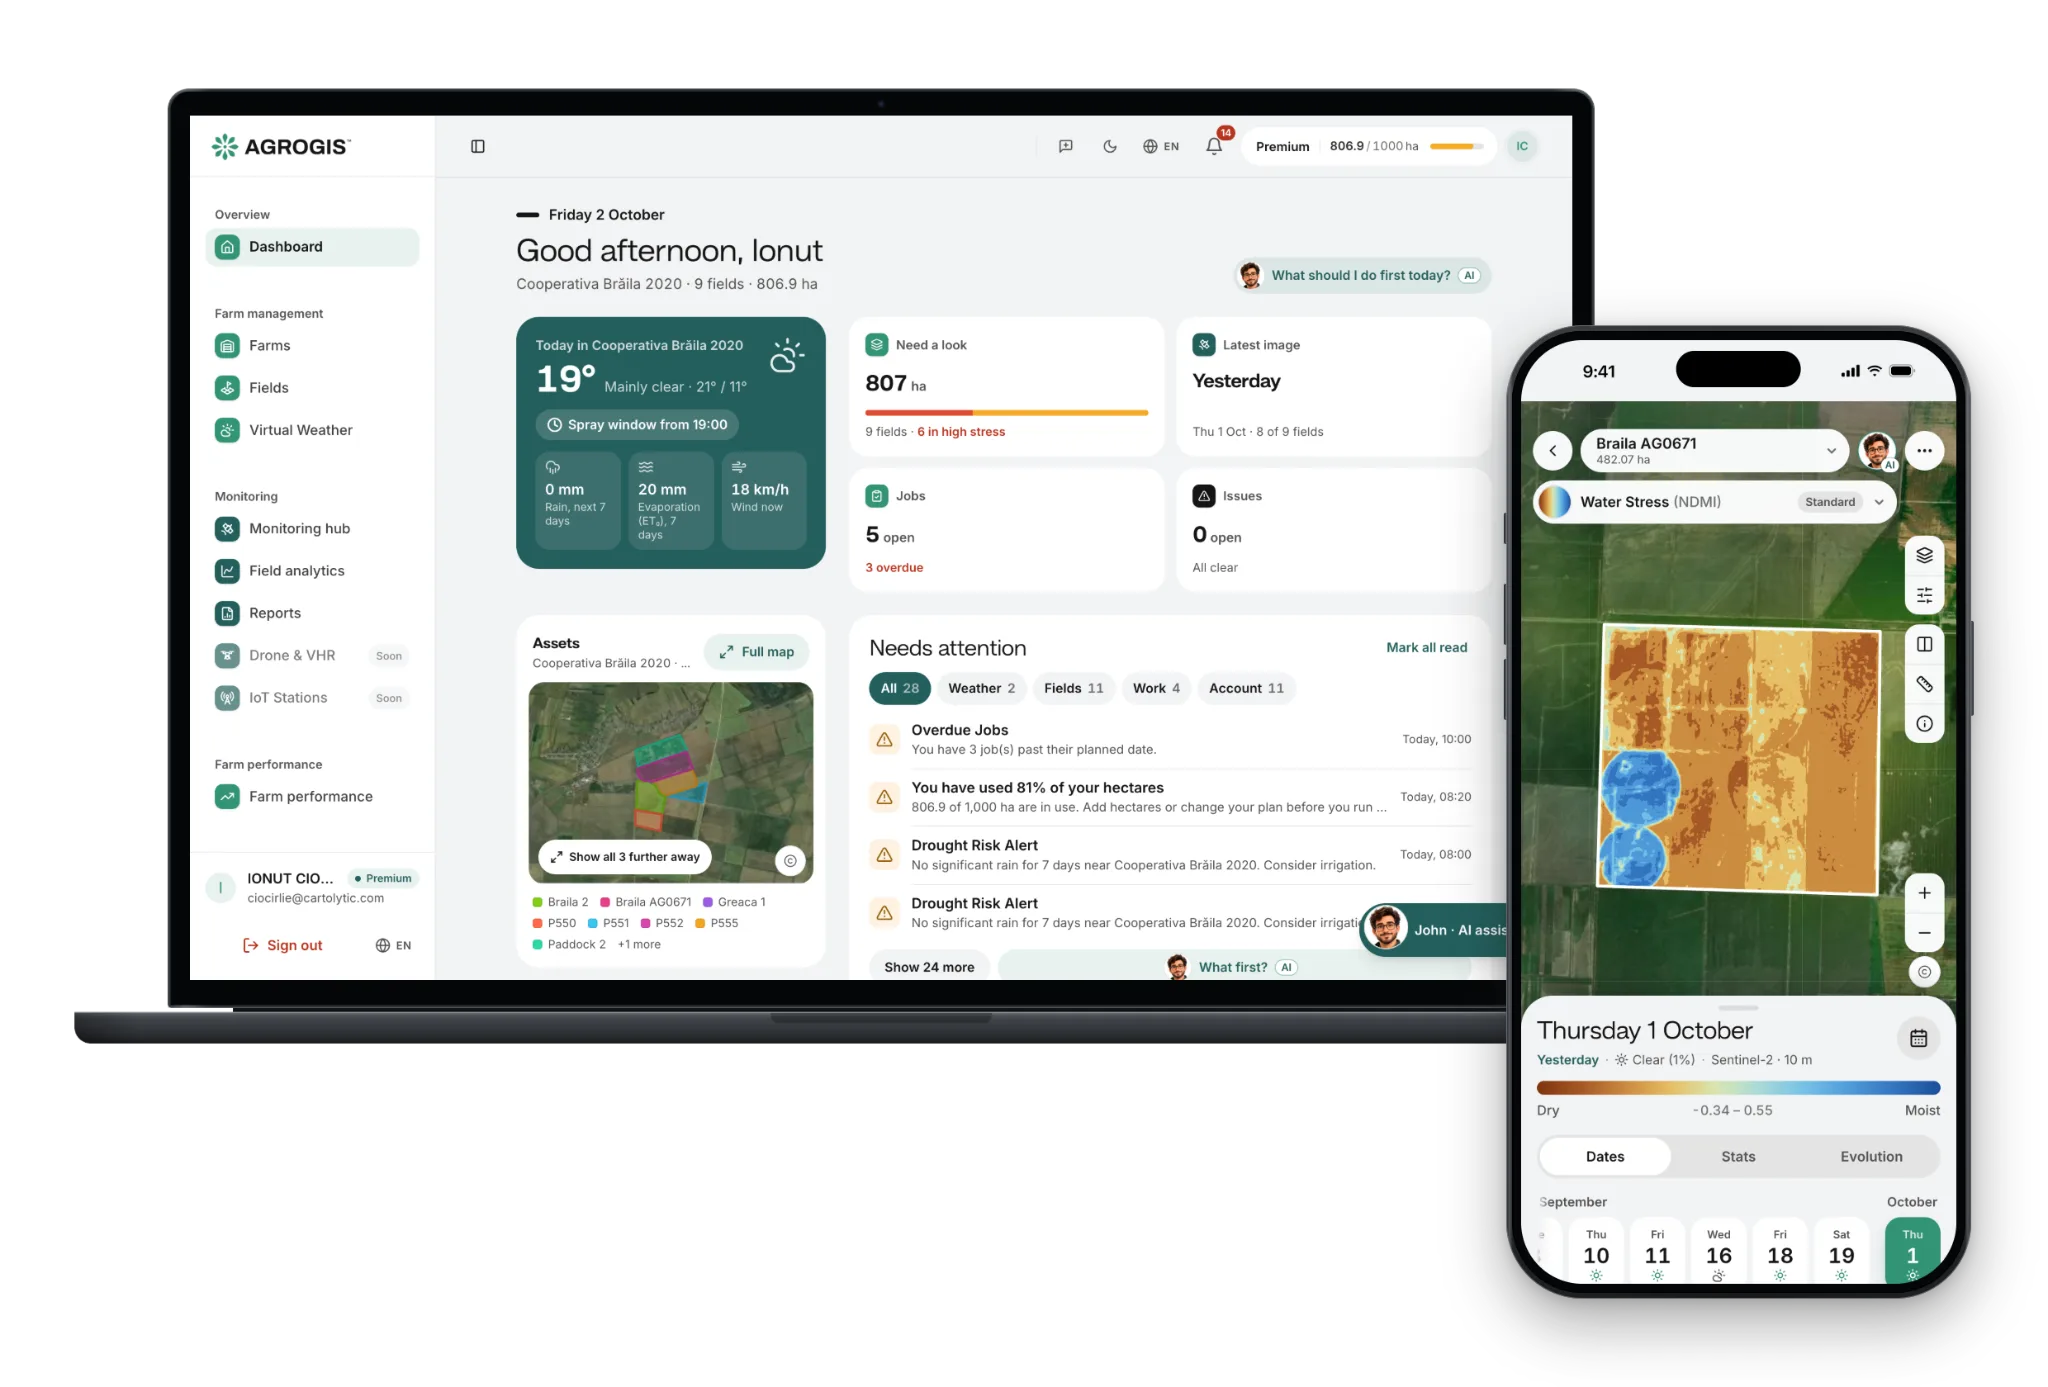
Check every parcel from the kitchen table. Drive out only where something changed.
Each clear satellite pass shows which parts of a field are behind the rest — walk those first.
A rate per zone, exported as ISOXML or a shapefile your terminal reads. Premium.
Cost per hectare from the jobs you log; margin per field once you enter the harvest revenue.
Hourly forecast and frost, heat, rain and wind alerts for your farm's coordinates. Included in Premium; an add-on on Basic.
The same field, the same week, year against year.
The phone records the ground you covered; add a GNSS receiver and it shows the next pass to follow.
Due-diligence reports, the spray register and season figures, each exportable as a PDF.
Each module is a self-contained workflow tied to your fields. Use one, use all eight — they share data, permissions, and a single bill.
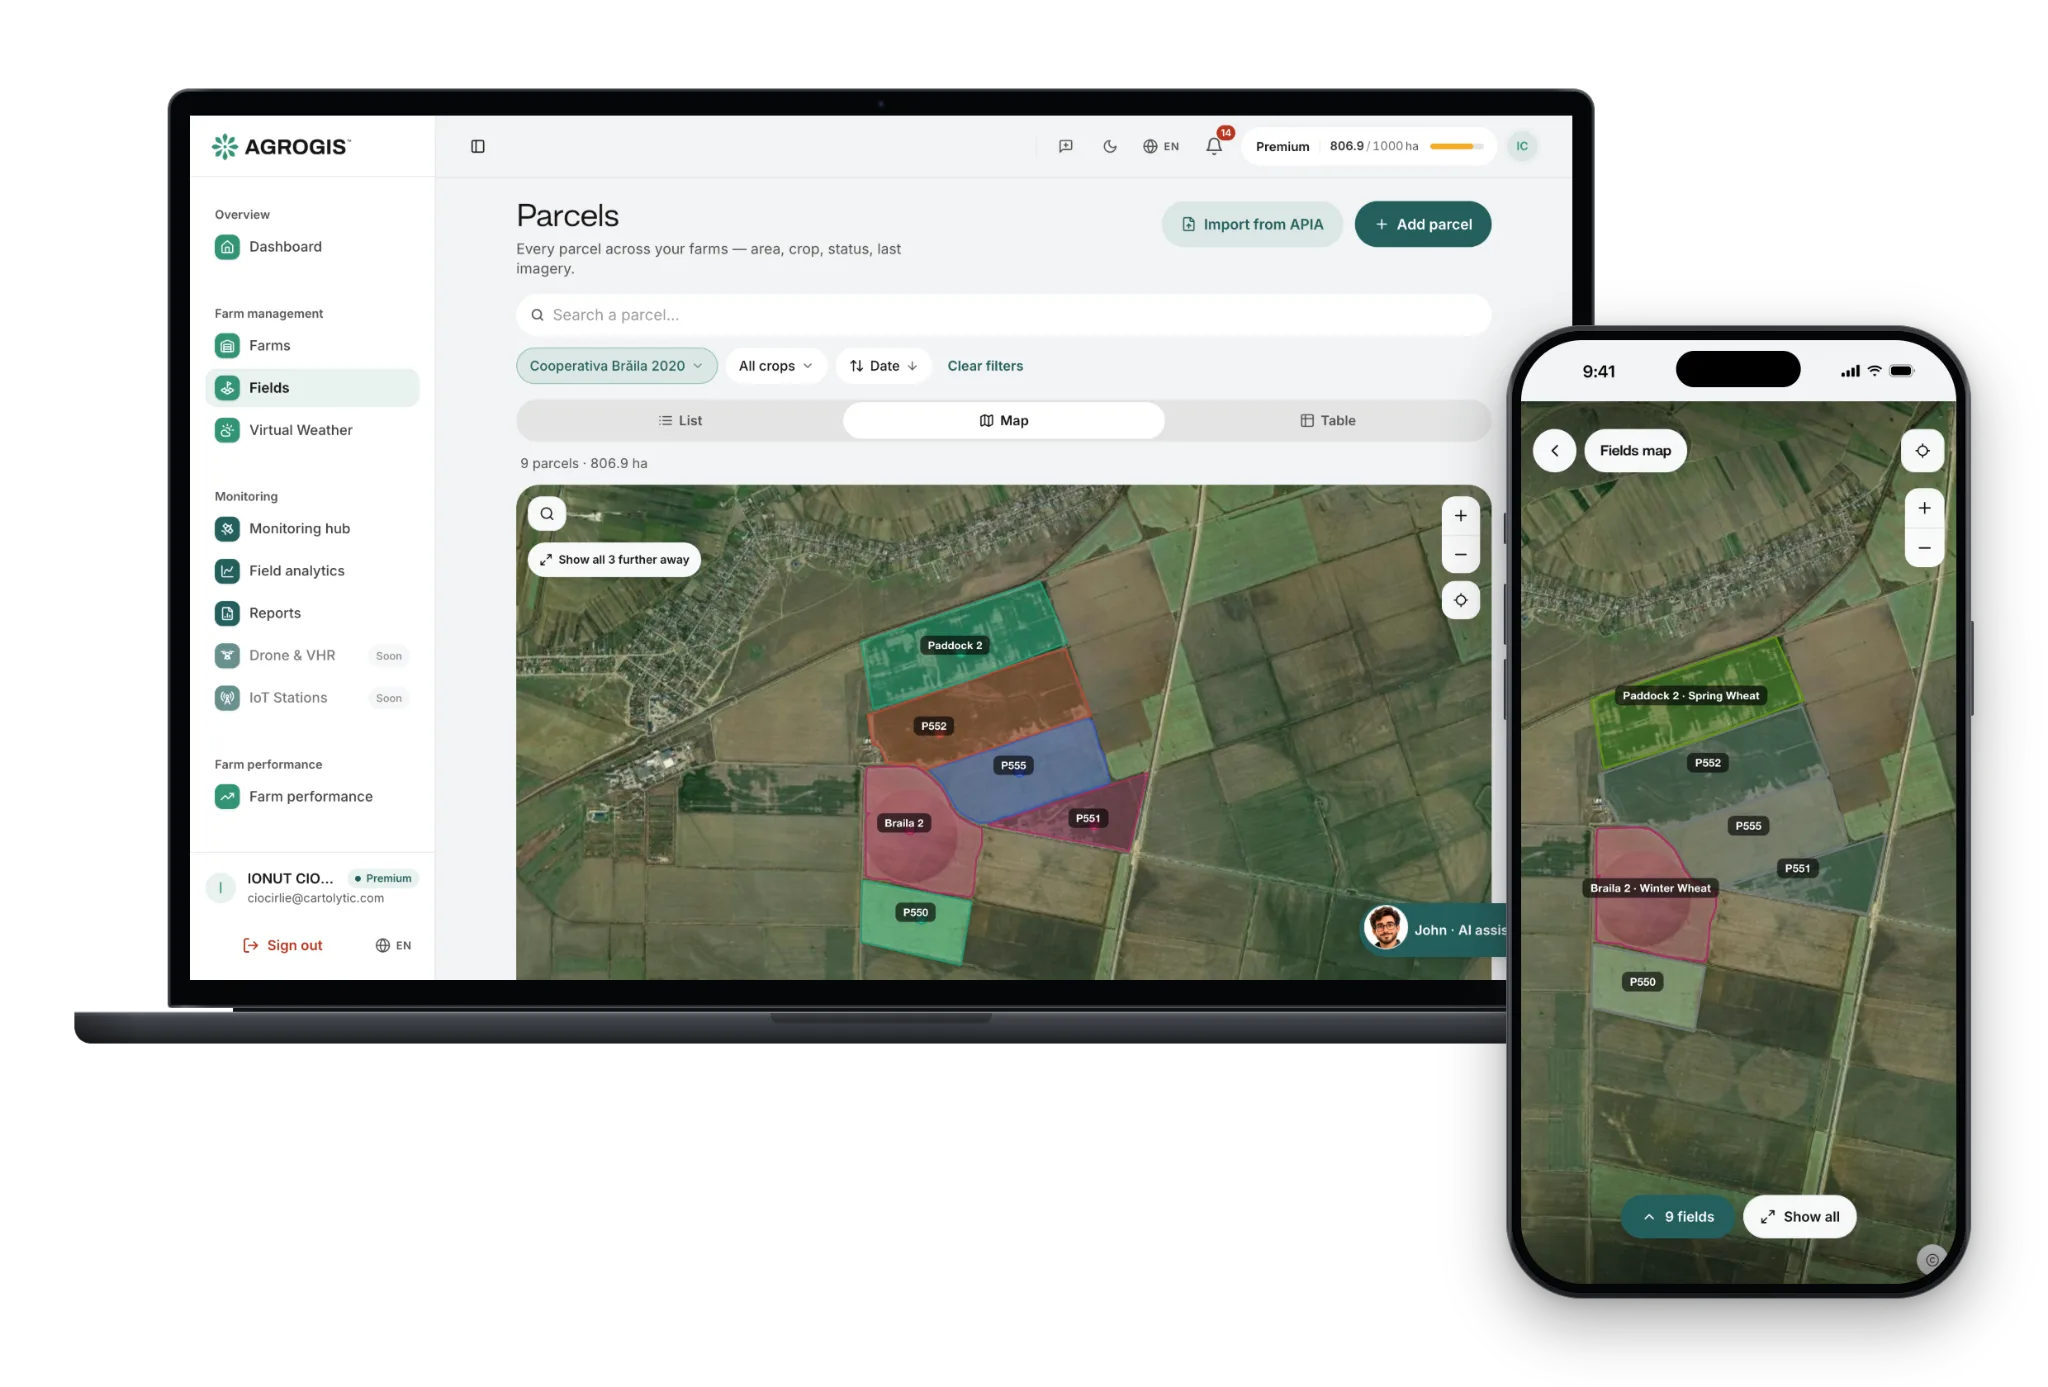
The starting point of every AGROGIS workspace. Create organizations, invite team members, define farms, and digitize fields with the on-map editor — or upload existing GeoJSON, KML or KMZ boundaries.
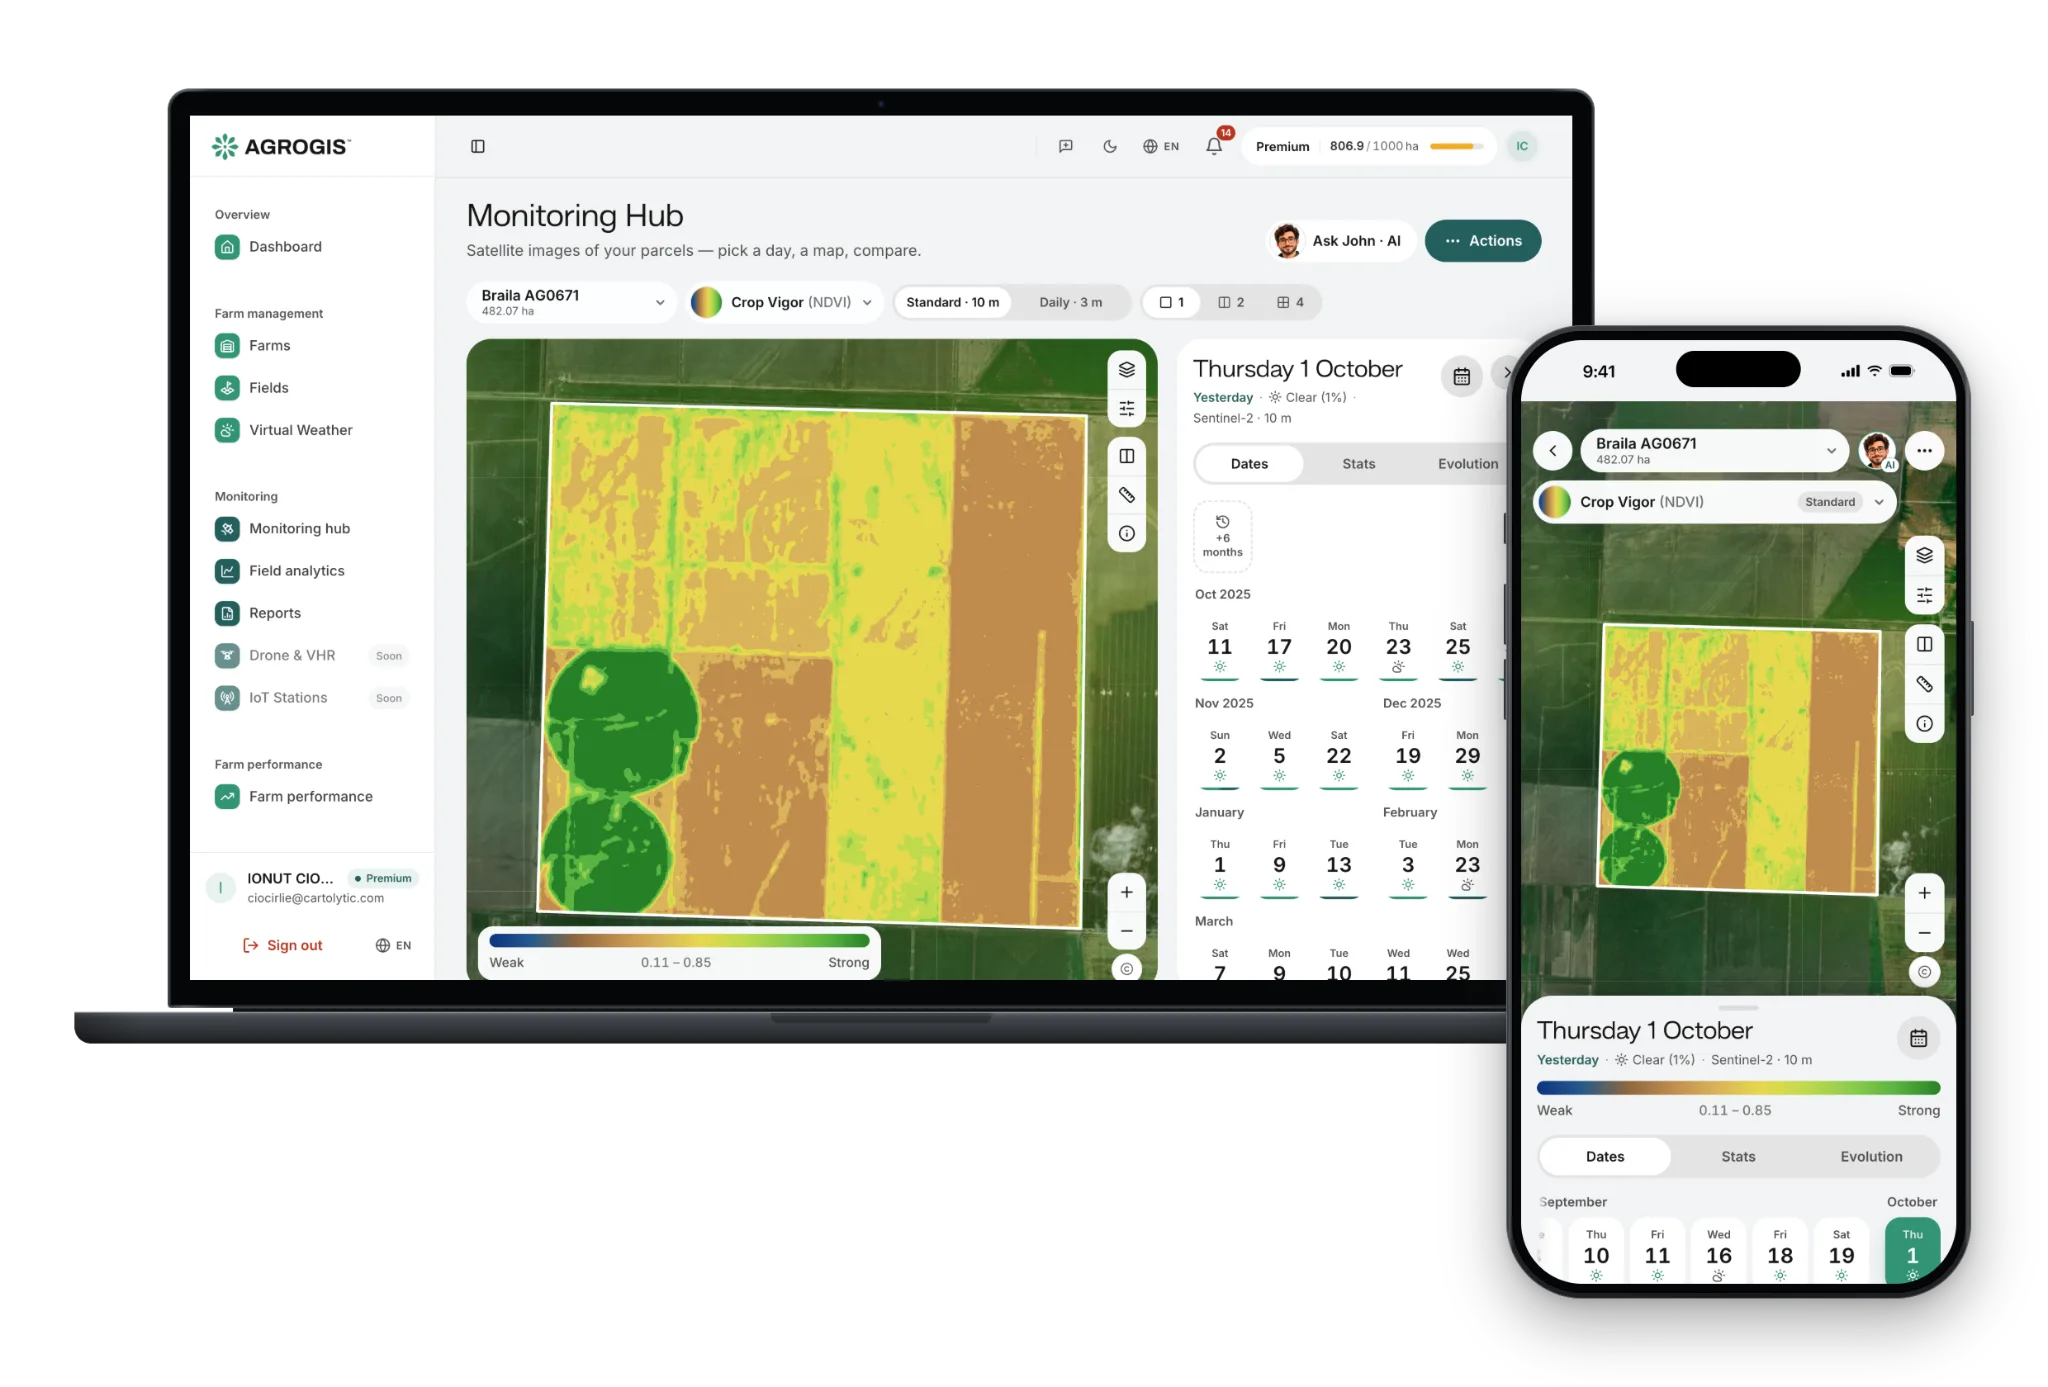
See your fields from space. The monitoring hub overlays satellite imagery on a precise field boundary — NDVI, NDMI, MSAVI, NDRE, NDWI, EVI and surface temperature (LST) on the included imagery, refreshed as new acquisitions become available.
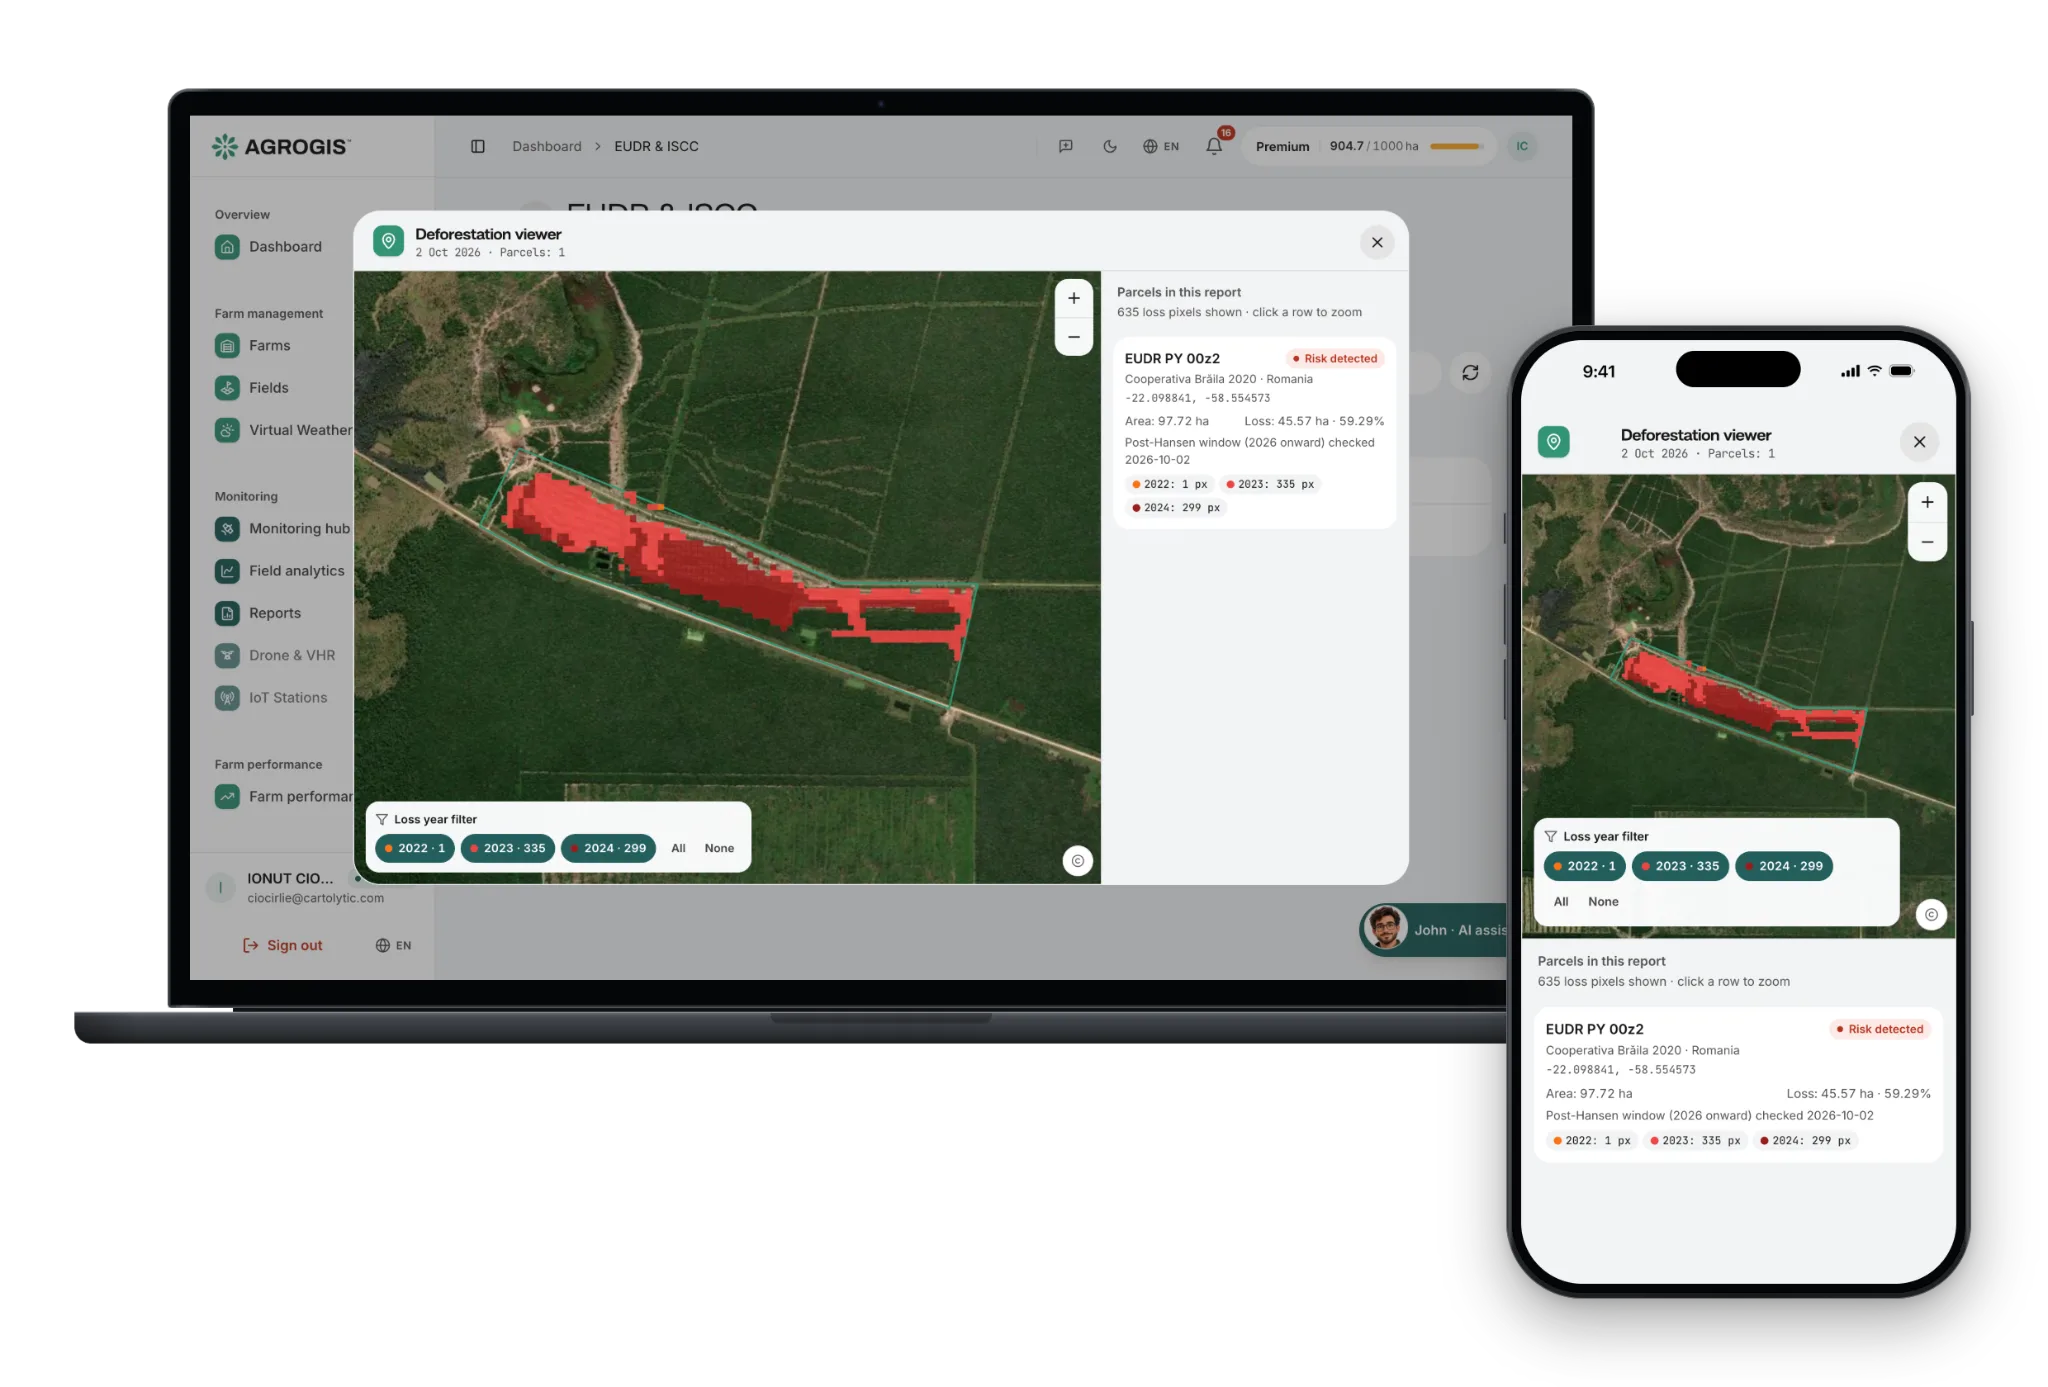
A single compliance module that produces both EUDR reports (EU Deforestation Regulation, 31 December 2020 cutoff) and ISCC reports (biofuel sustainability, 2008 cutoff). Same data layers, same per-parcel pipeline, two regulatory framings.
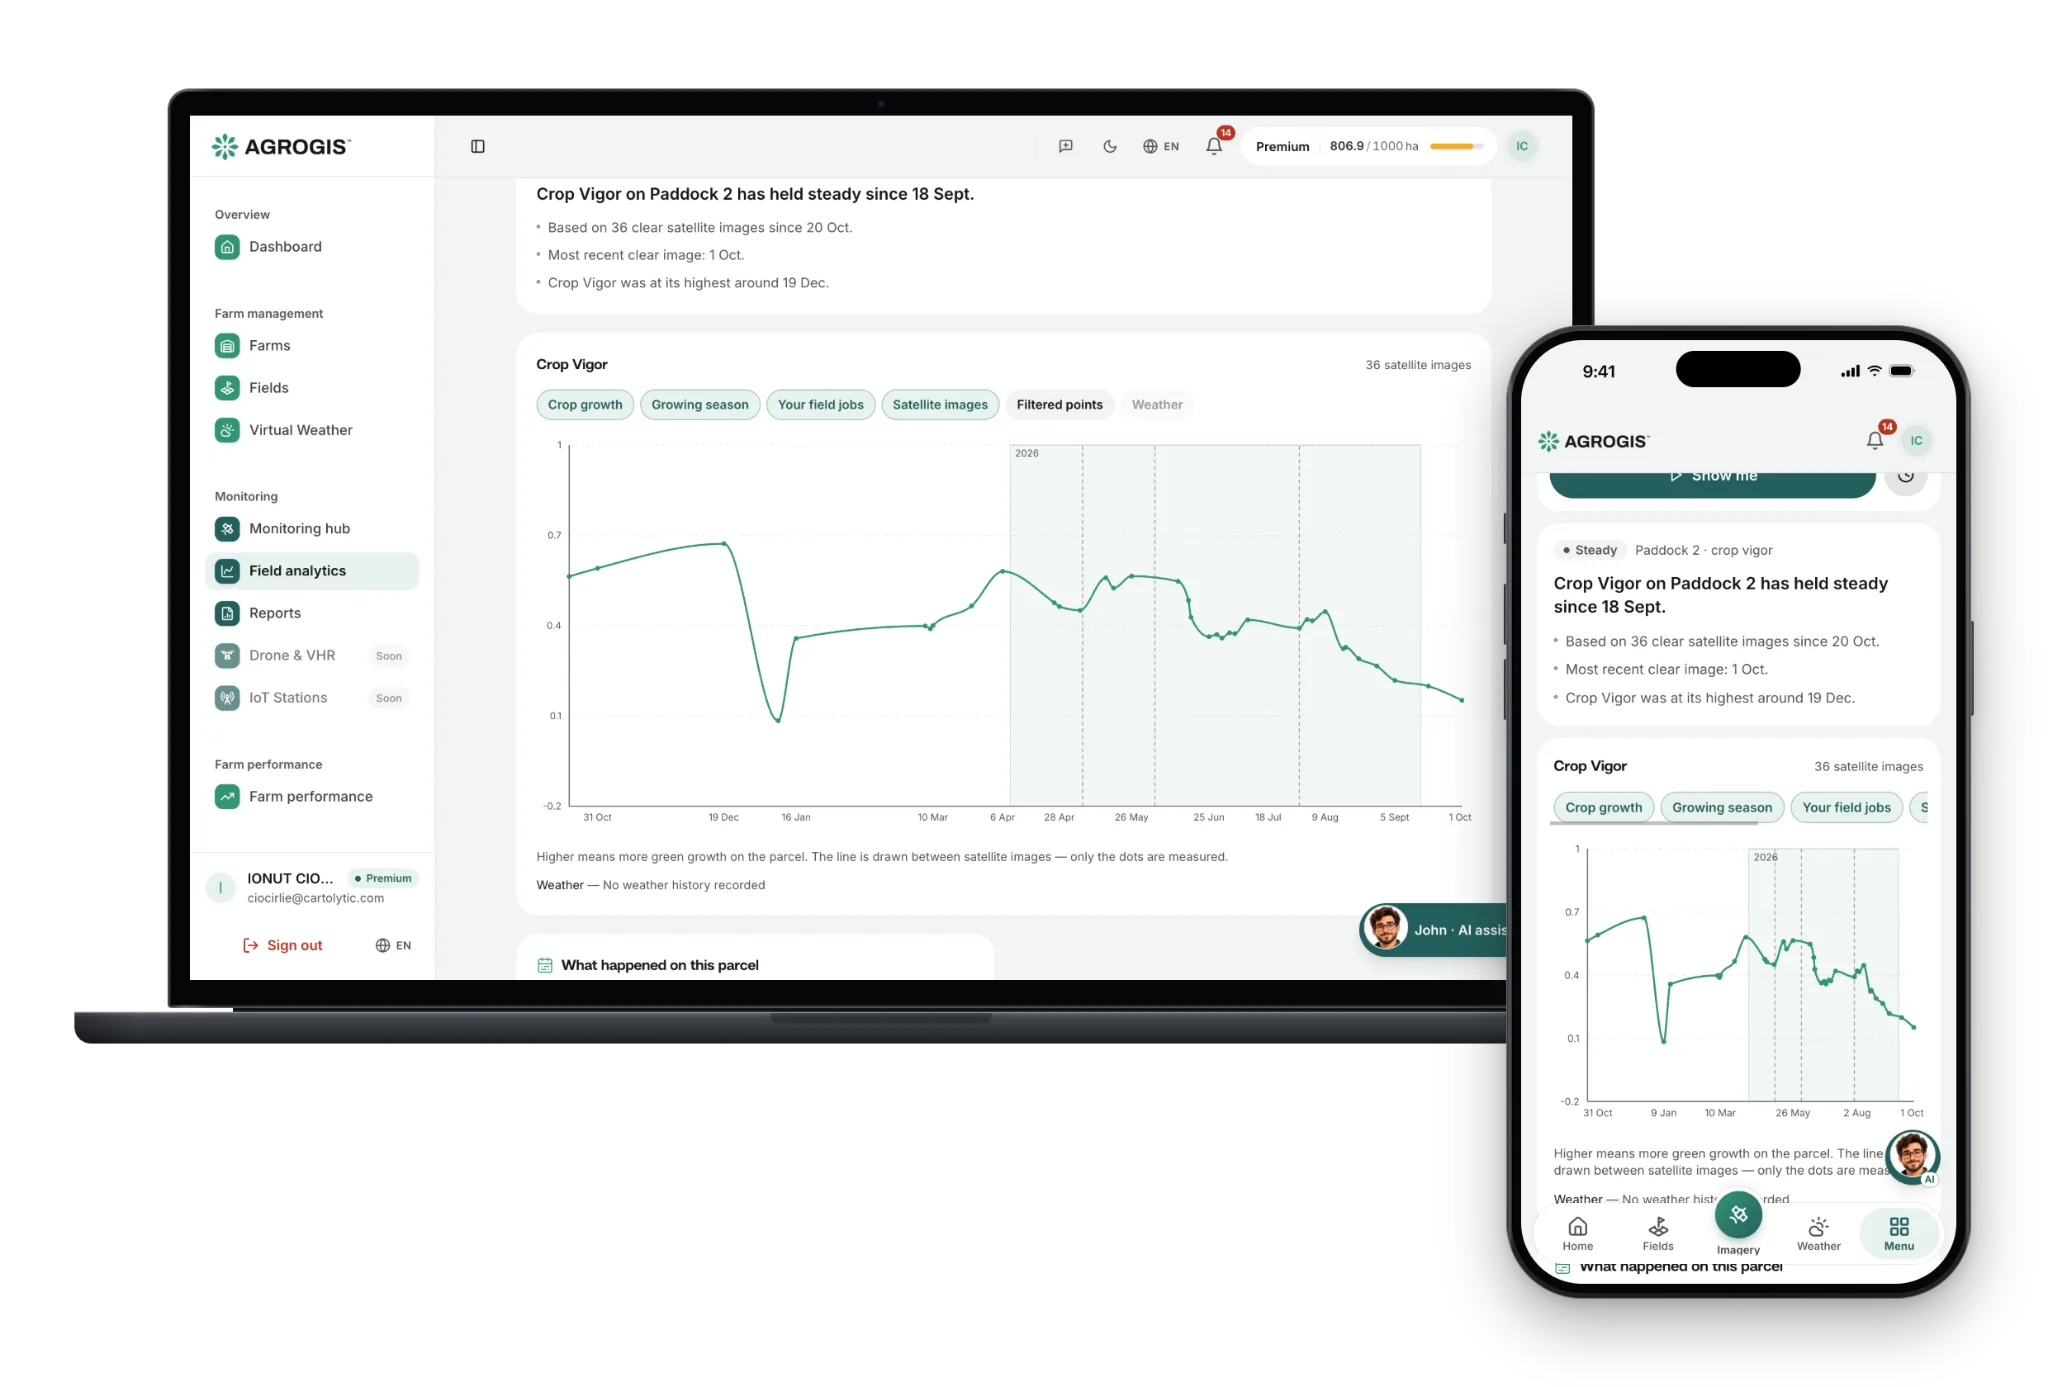
Field analytics reads the per-scene statistics AGROGIS keeps for each parcel — min, median, max, standard deviation and cloud cover per observation — and turns them into a season curve you can compare across fields and across years.
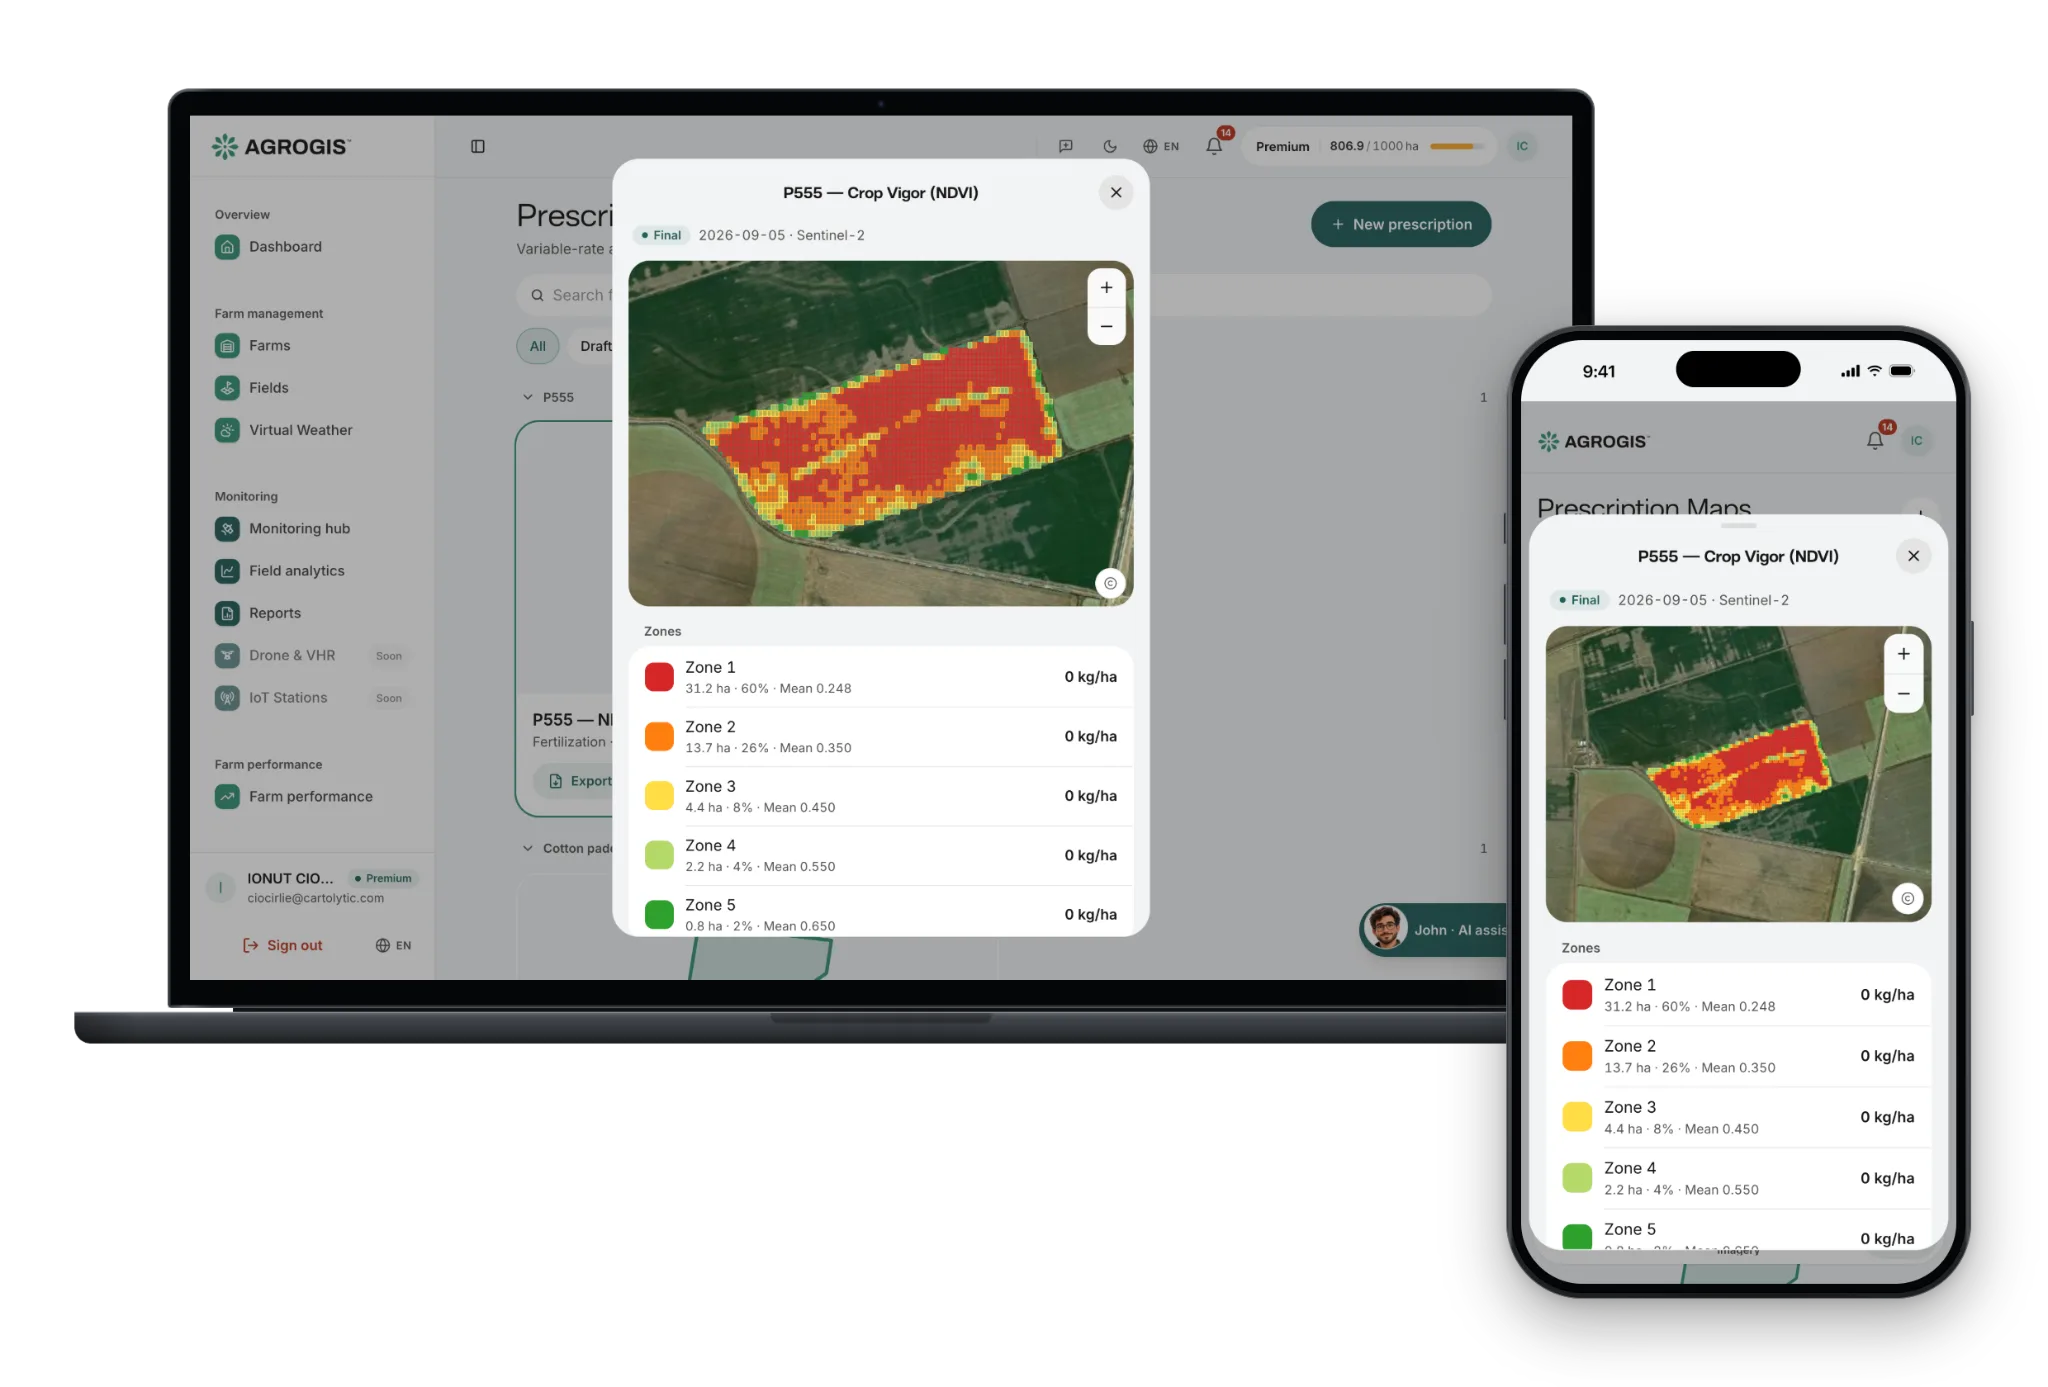
Turn a satellite index histogram into a variable-rate application (VRA) prescription. Pick the index, choose how the zones are cut — equal-interval, quantile, natural breaks or thresholds you set yourself — set a rate per zone, preview it on the parcel, and export.
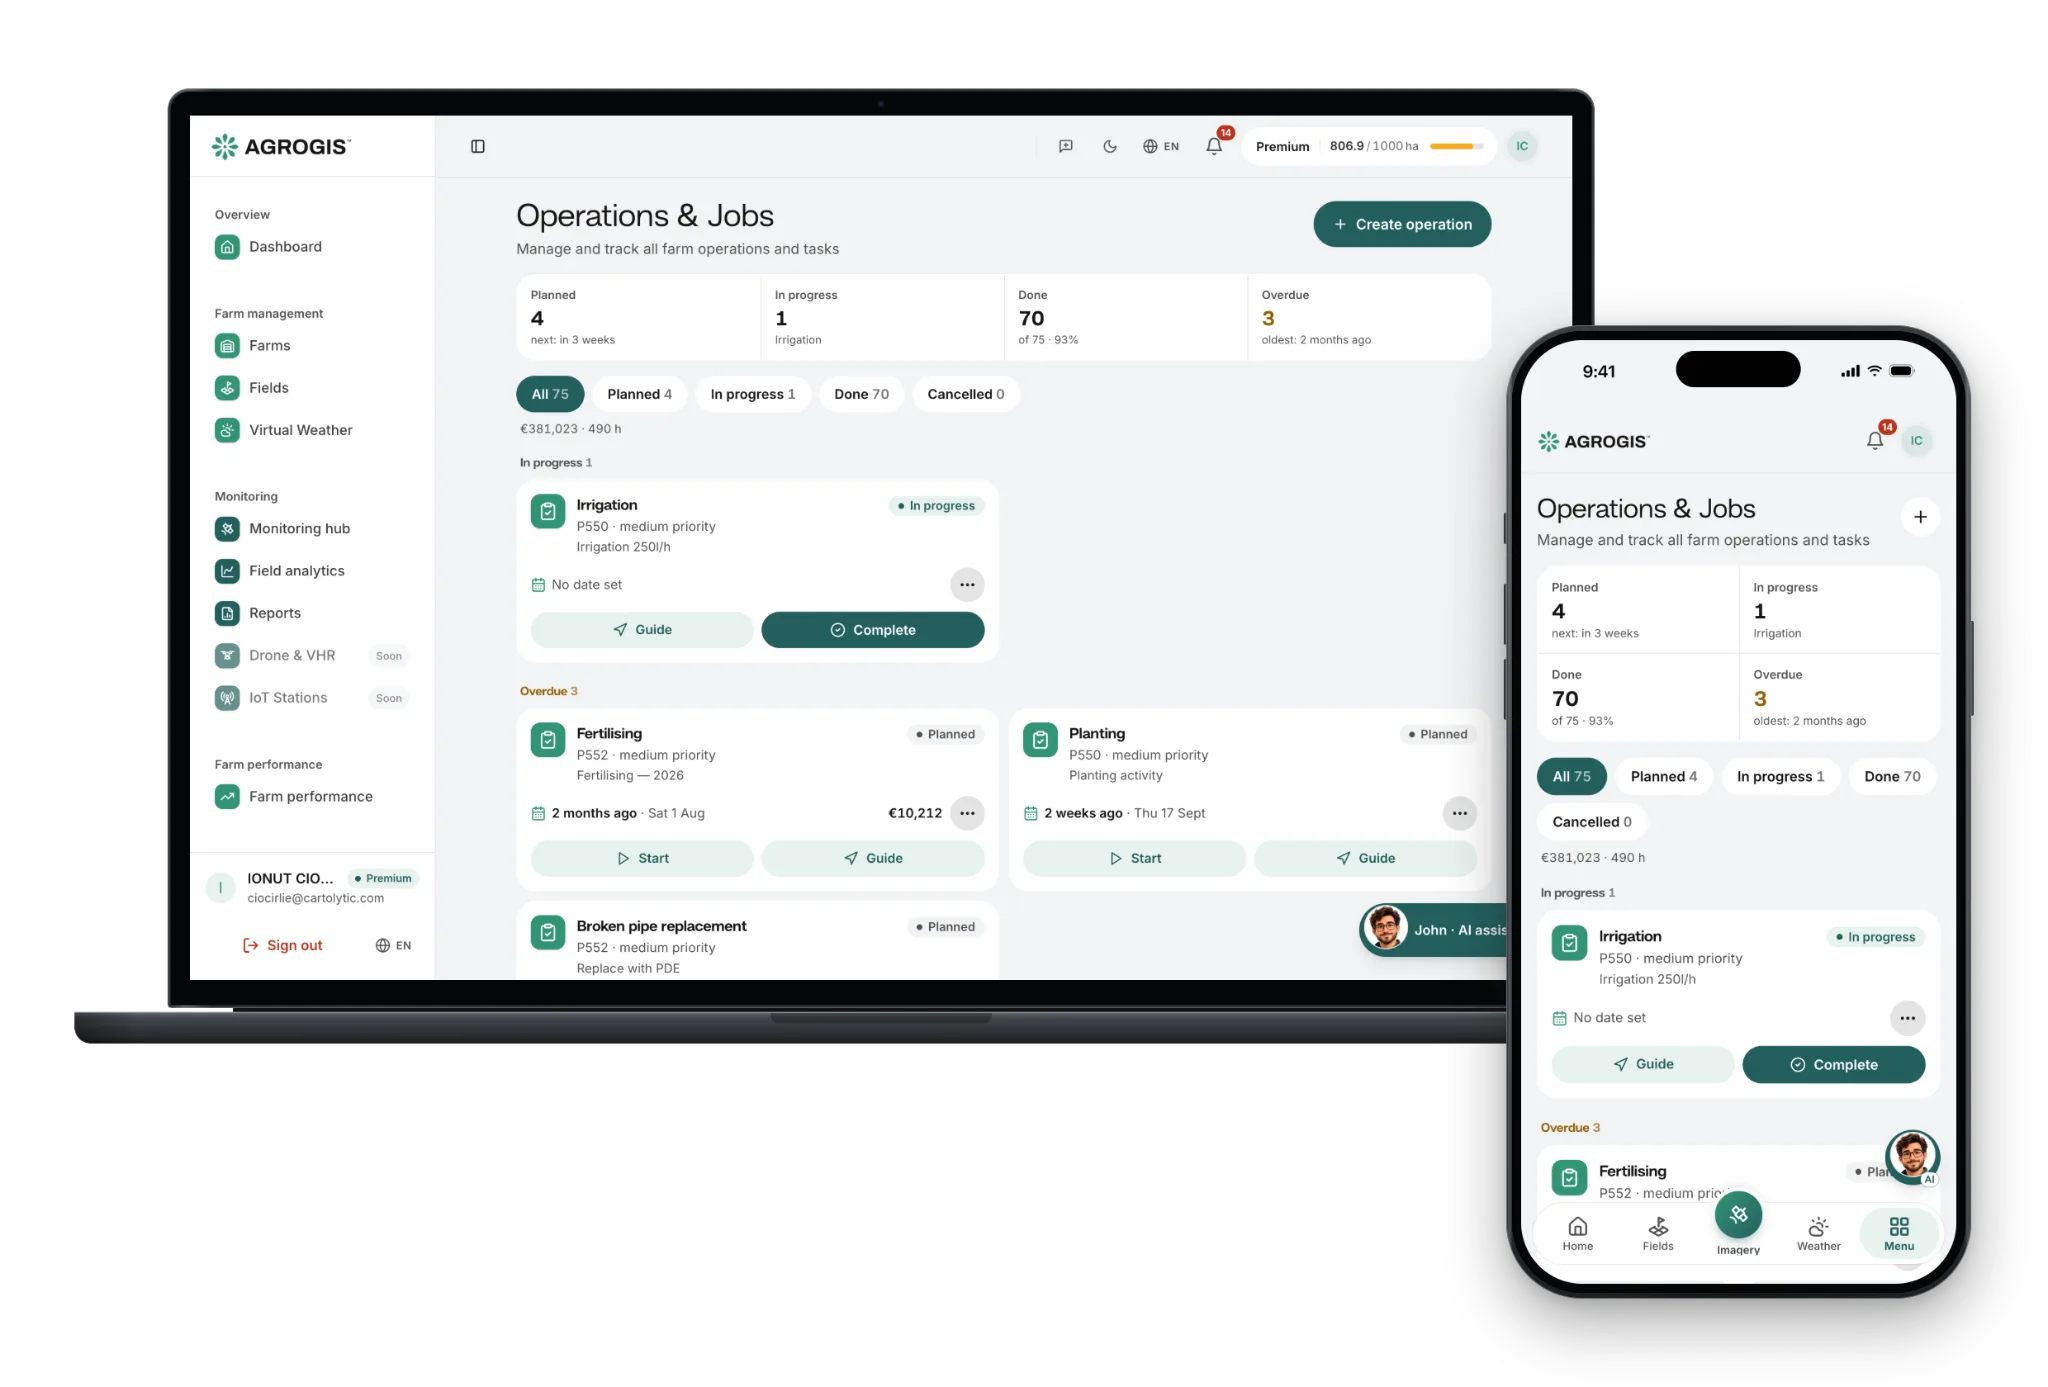
Plan and record what happens on your fields. Schedule jobs, assign equipment, log planned against actual hours and cost, and close them out. Track issues, diseases and damages separately, each pinned to a point on the map with photos taken on the spot.
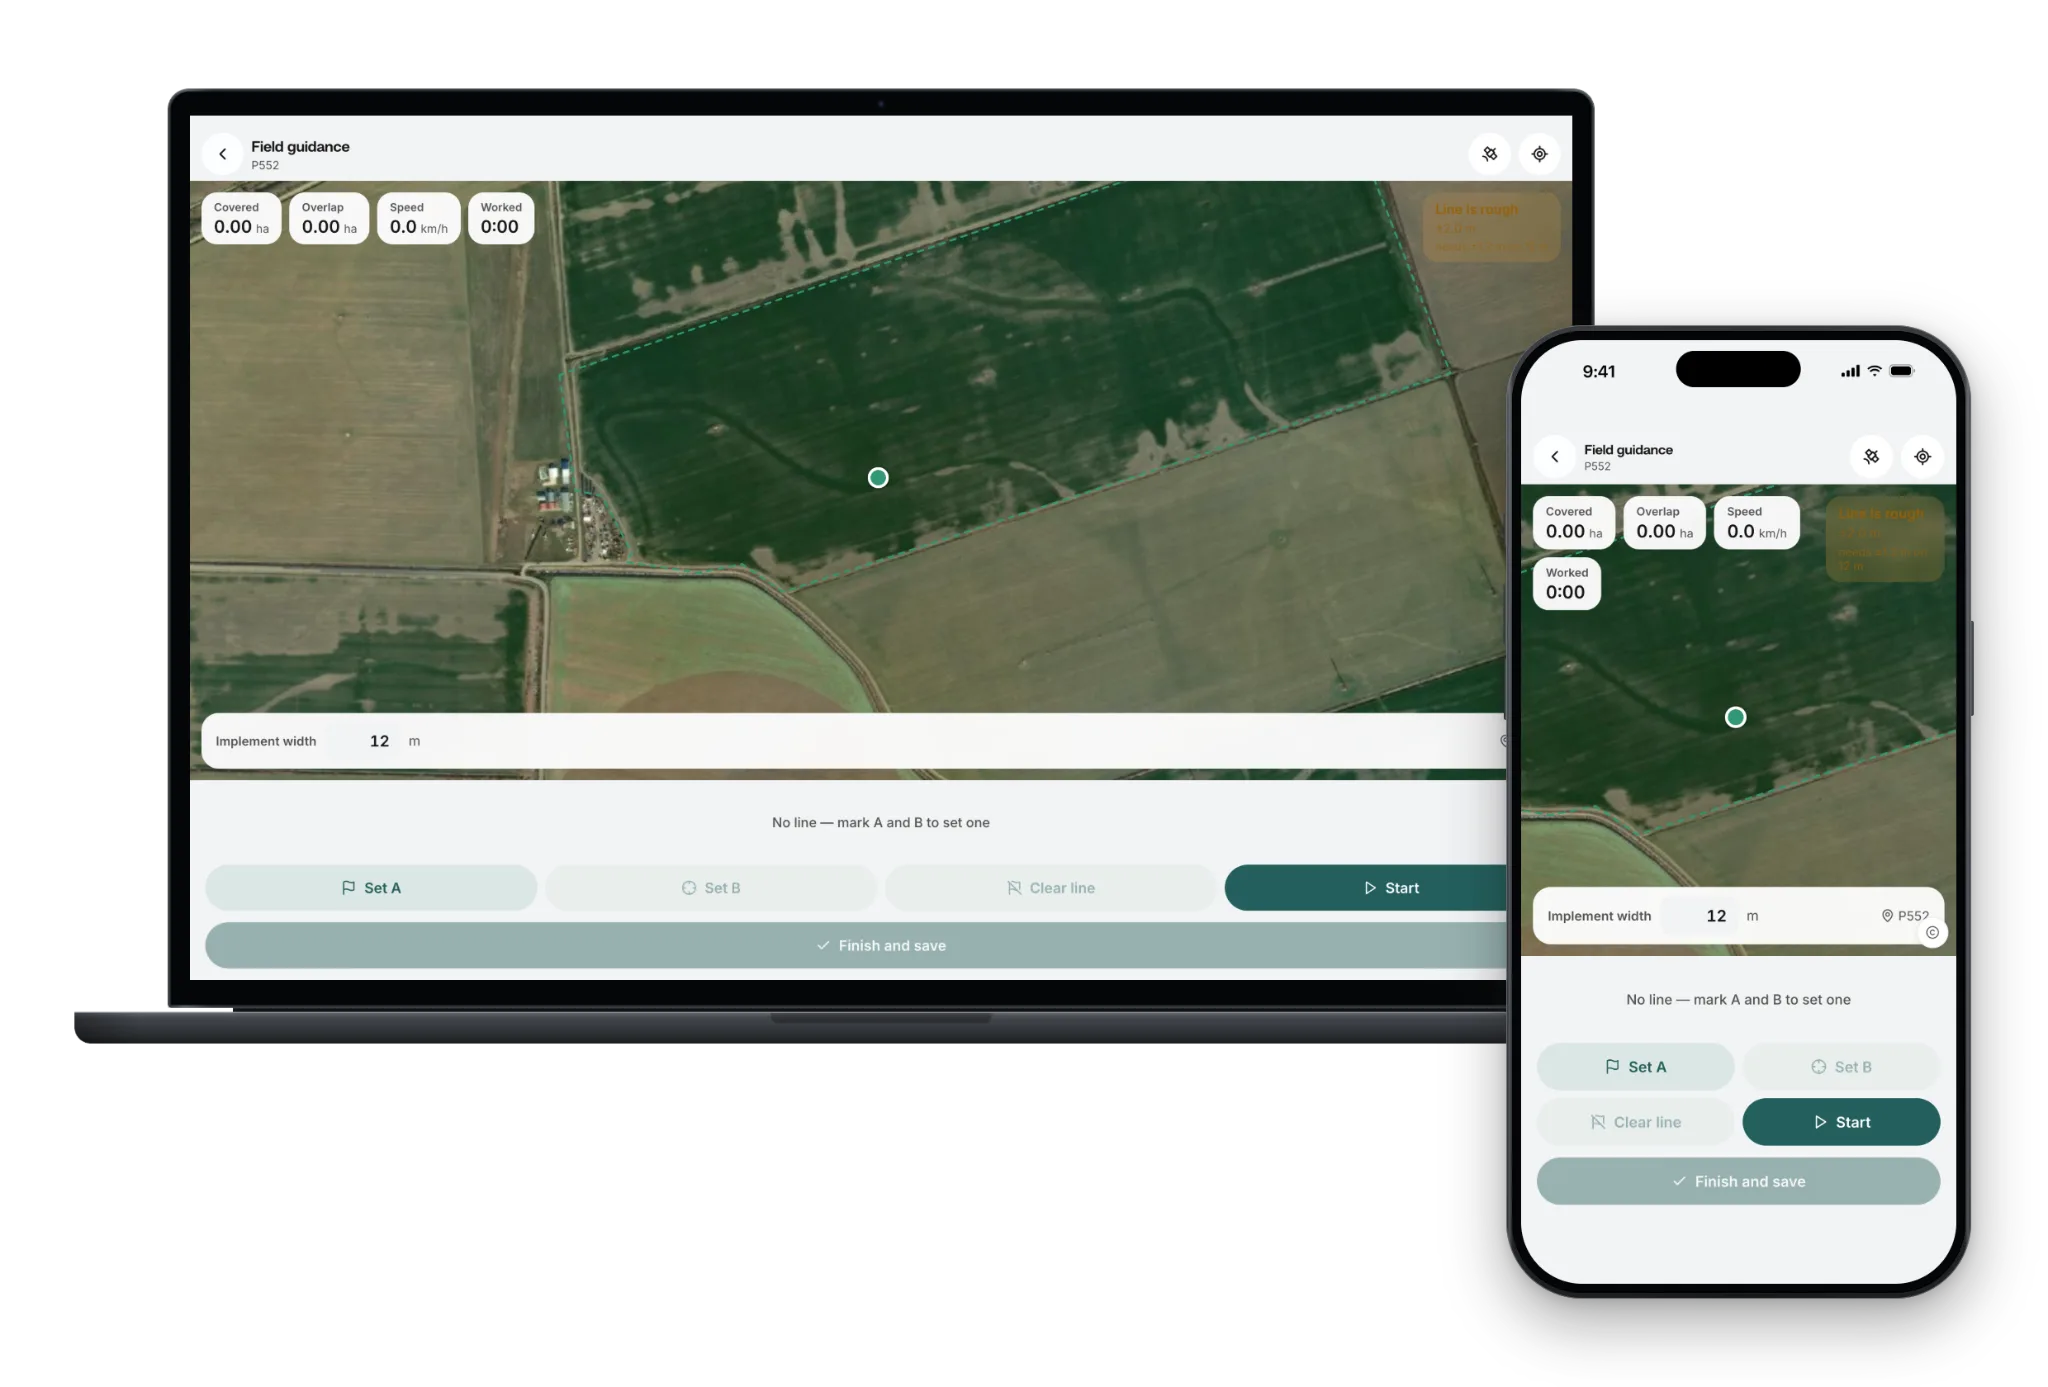
Mount the phone in the cab and it works as a lightbar: it draws the next pass from the A-B line you set, and records the ground the machine actually covered. It does not move the machine — there is no autosteer and no connection to the tractor.
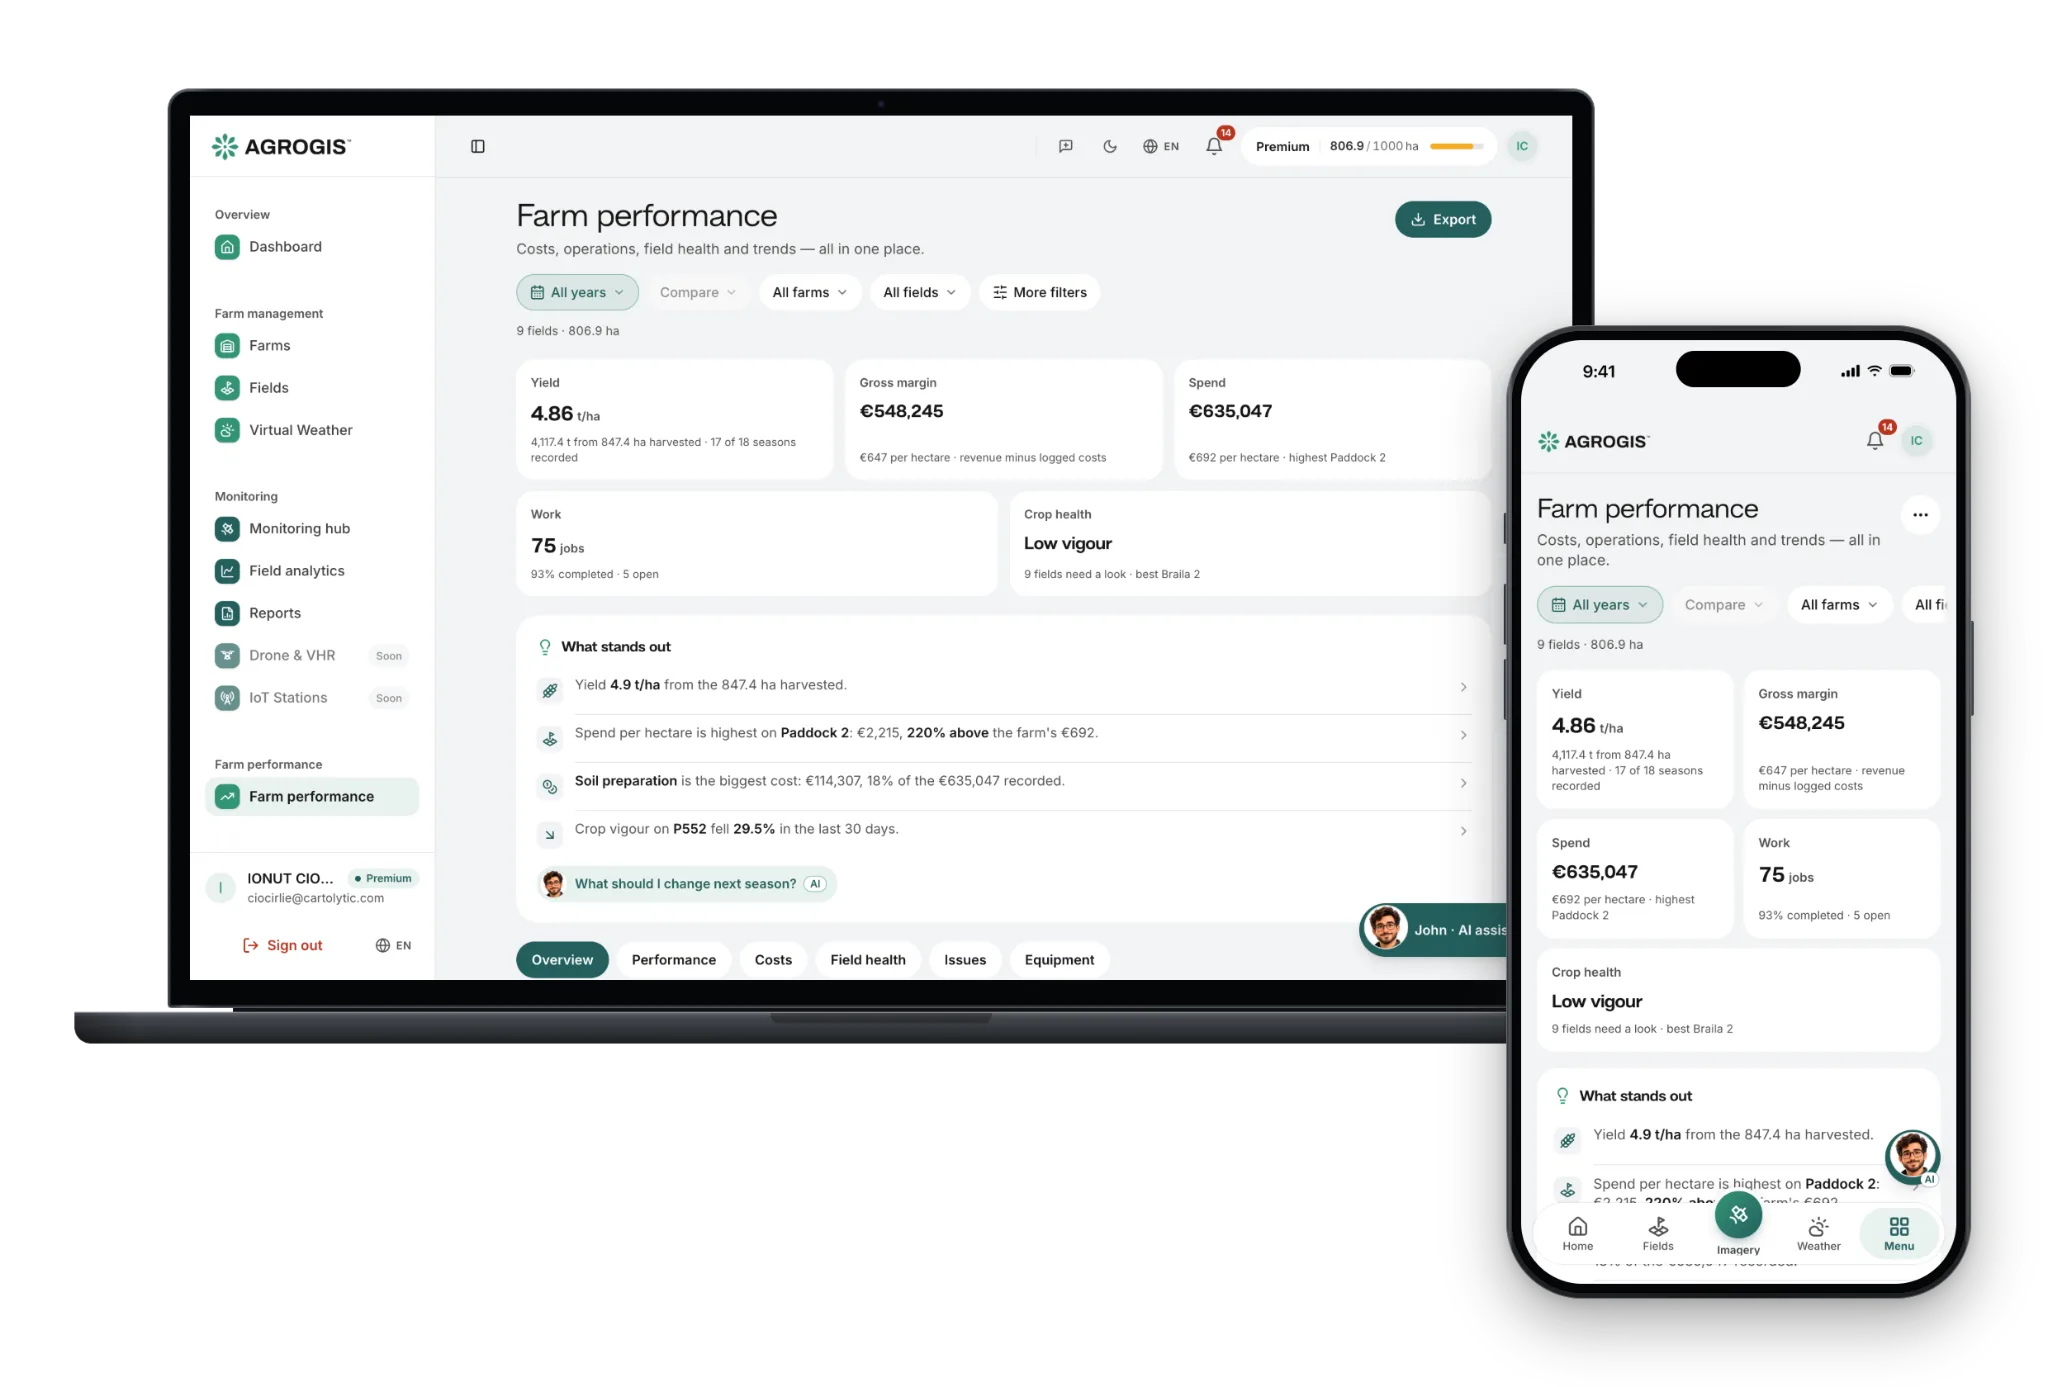
The cost and activity picture across the whole workspace. Total cost and cost per hectare, spend by month, spend by field, and the operation and incident counts behind them — all derived from the jobs you logged, with no separate bookkeeping to keep in step.
The starting point of every AGROGIS workspace. Create organizations, invite team members, define farms, and digitize fields with the on-map editor — or upload existing GeoJSON, KML or KMZ boundaries.
See your fields from space. The monitoring hub overlays satellite imagery on a precise field boundary — NDVI, NDMI, MSAVI, NDRE, NDWI, EVI and surface temperature (LST) on the included imagery, refreshed as new acquisitions become available.
A single compliance module that produces both EUDR reports (EU Deforestation Regulation, 31 December 2020 cutoff) and ISCC reports (biofuel sustainability, 2008 cutoff). Same data layers, same per-parcel pipeline, two regulatory framings.
Field analytics reads the per-scene statistics AGROGIS keeps for each parcel — min, median, max, standard deviation and cloud cover per observation — and turns them into a season curve you can compare across fields and across years.
Turn a satellite index histogram into a variable-rate application (VRA) prescription. Pick the index, choose how the zones are cut — equal-interval, quantile, natural breaks or thresholds you set yourself — set a rate per zone, preview it on the parcel, and export.
Plan and record what happens on your fields. Schedule jobs, assign equipment, log planned against actual hours and cost, and close them out. Track issues, diseases and damages separately, each pinned to a point on the map with photos taken on the spot.
Mount the phone in the cab and it works as a lightbar: it draws the next pass from the A-B line you set, and records the ground the machine actually covered. It does not move the machine — there is no autosteer and no connection to the tractor.
The cost and activity picture across the whole workspace. Total cost and cost per hectare, spend by month, spend by field, and the operation and incident counts behind them — all derived from the jobs you logged, with no separate bookkeeping to keep in step.
John, the AI assistant, reads what the platform holds about your farm — parcels, their satellite history, jobs, open issues and the forecast — and answers in your language, whenever you ask.
Ask why a parcel changed. John reads its satellite history date by date, always comparing images from the same satellite, and tells you in plain words what moved and what to check in the field.
It reads your open issues and recent jobs, and the forecast for your farm on Premium or with the weather add-on, to help you choose when to scout, spray or irrigate.
Day or night, weekends included, in Romanian, English, Italian, Spanish or French. John answers your own questions on the paid plans — Basic, Premium and Enterprise; during the free trial it shows example questions and answers.
John is an AI, not a person. It asks for your consent before it reads your data, only reads it and changes nothing in your account, recommends no products, gives no doses for plant-protection products or fertilisers, and can be wrong — the decision is always yours, so check anything important with an agronomist or our support team.
Can I spray Field 2 tomorrow?
Tomorrow the forecast for your farm has the wind rising to about 25 km/h after 11:00 and rain from late afternoon, so the calmer window is early morning, before 10:00. Check the product label for its own wind and rain limits — I don’t advise on products or doses.
AGROGIS is not a closed system. The standard imagery underneath it is public (Sentinel-2, Landsat), and everything it produces leaves in a format something else already understands.
One workspace
One workspace
Not every AGROGIS service is inside the app. Some things — like drone surveys, off-grid irrigation systems, or carbon project consulting — are services we deliver with our partners, scoped per project. Below is what lives outside the platform.
AGROGIS does not try to be the whole world. It is opinionated about the agronomy and compliance side, and open about everything else.
30 days free on up to 10 hectares, no card. After that, choose Basic or Premium to keep working — your fields and records stay in your account.
30 days free on up to 10 hectares, no card. After that, choose Basic or Premium to keep working — your fields and records stay in your account.