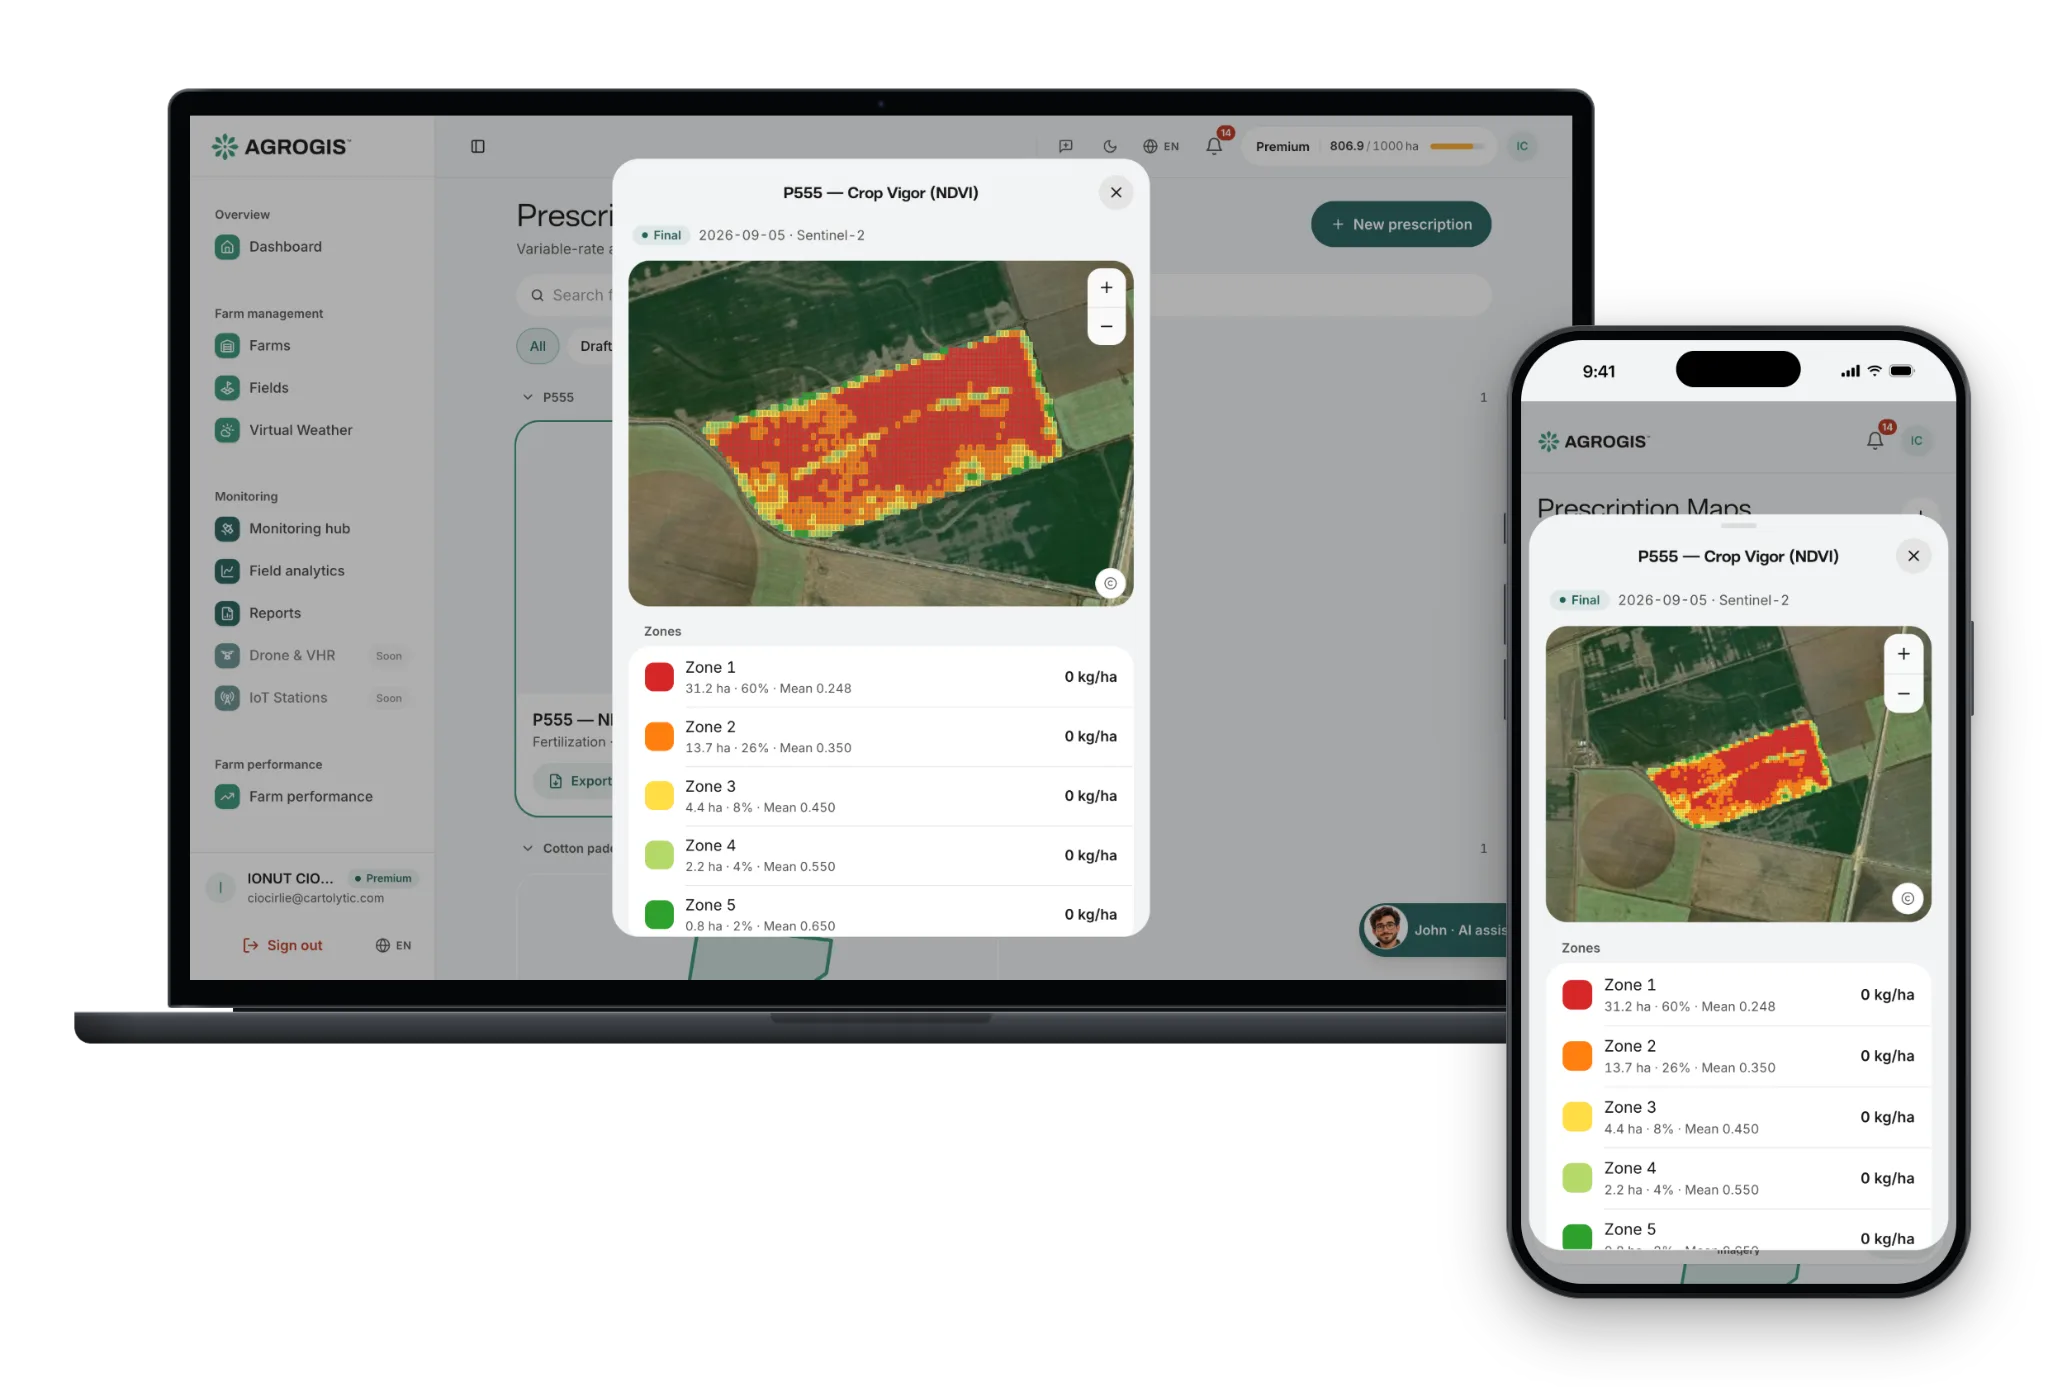
Convert satellite indices into machine-ready VRA maps for sprayers, spreaders and seeders.
Spend on inputs where they pay back. AGROGIS splits the parcel into zones by the crop's vigour seen from satellite, you set the rate for each, and the map comes out ready for the terminal in your tractor — in minutes, not days. Prescription maps are part of the Premium and Enterprise plans.
Field D, 84 hectares in the Bărăgan plain, June 2025: how what the satellite saw becomes a rate for each part of the field. Scroll, then try your own rates.
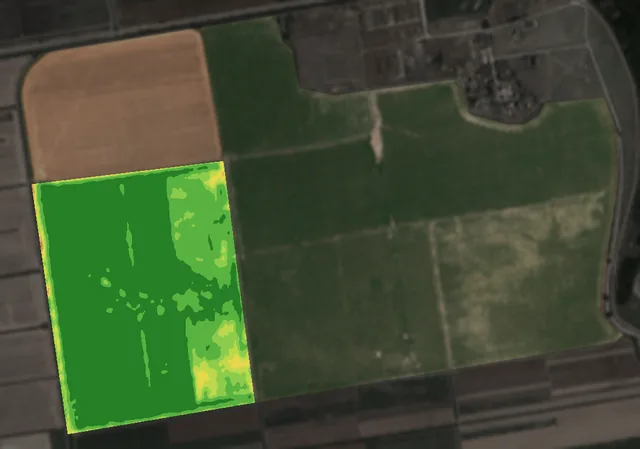
DCrop Vigor · 18 June 2025
bare soildense crop
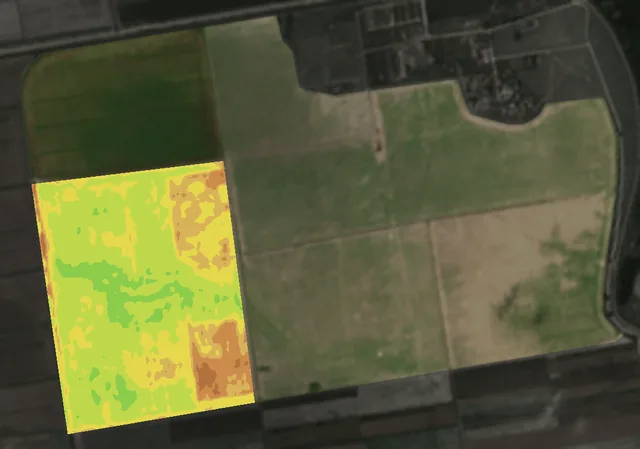
DEarly Growth · 2 June 2025
not up yetstrong emergence
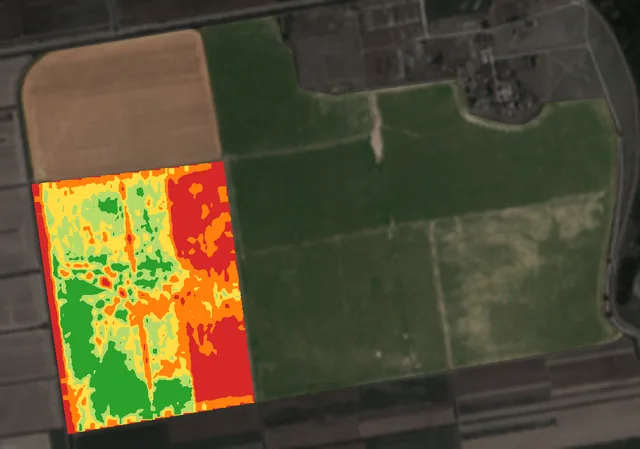
DApplication zones · 18 June 2025
weakest zonestrongest zone
DApplication zones · 18 June 2025
weakest zonestrongest zone
1
The satellite shows the weak part
On 18 June, 15 hectares of field D, nearly a fifth of it, grew a quarter weaker than the rest.
Not the whole field: one patch, with a straight western edge.
What you do: Go and look at that patch first.
DCrop Vigor · 18 June 2025
bare soildense crop
2
And since when
On 2 June much of that same ground had barely come up.
The problem started at sowing or emergence, not in June.
What you do: Find the cause for next season; adjust the inputs for this one.
DEarly Growth · 2 June 2025
not up yetstrong emergence
3
Five zones from the crop’s vigour
The app splits the field into zones by the crop’s vigour on the date you pick: here five, of about 15 to 18 hectares each.
You choose how many zones, from 3 to 7, and which satellite image they come from.
What you do: Check that the zones match what you saw in the field.
DApplication zones · 18 June 2025
weakest zonestrongest zone
4
A rate for each zone, then the tractor
You set a rate for each zone, and the app shows the area and the total product before you export.
The map goes to the tractor’s terminal as ISOXML, as a shapefile for John Deere, Trimble or Ag Leader, or as GeoJSON, KML, CSV or GPX. Prescription maps are part of Premium and Enterprise.
What you do: Try it below: change a zone’s rate and watch the total.
Try it: a rate for each zone of field D
Zone
Area
Rate, kg/ha
Product
1
18.3 ha
1,830 kg
2
17.7 ha
1,770 kg
3
16.1 ha
1,610 kg
4
15.7 ha
1,570 kg
5
14.8 ha
1,480 kg
Field D
82.6 ha
8,260 kg
Zone areas measured on the map above. In the app you choose what the map is for — Fertilization (kg/ha), Planting (seeds/ha), Crop Protection (L/ha) or Irrigation (mm) — and from 3 to 7 zones.
DApplication zones · 18 June 2025
weakest zonestrongest zone
Maps from 2025 Sentinel-2 images, in the same colours as in the app. Contains modified Copernicus Sentinel data 2025.
What you get
Everything you need to make field decisions based on data — not assumptions. Features included in this solution:
/ 01
Zoning from any supported satellite index histogram
/ 02
Configurable zones (3–7 management zones)
/ 03
ISOXML, Shapefile, GeoJSON, KML, CSV and GPX export
/ 04
Shapefile profiles for John Deere, Trimble and Ag Leader
/ 05
Tied to the field record in the platform — audit trail
/ 06
Rate, area and total product per zone before you export
How it works
How it works, step by step, from the first message to the result.
1
Pick a field and date
Recent NDVI image as the source.
2
Configure zones
Choose 3–7 zones and rates per zone.
3
Preview the map
Visual confirmation before export.
4
Export and apply
Download in your machine's format.
Frequently asked
Which machines does this support?
ISOXML for ISOBUS terminals, and shapefiles built to the John Deere, Trimble and Ag Leader column conventions. Generic ISOXML works with most modern equipment; if your terminal wants something else, tell us which and we will look at it.