
All solutions

Climate Risk Analysis

Flood risk, drought stress and extreme-weather analysis for farms, lenders and insurers.

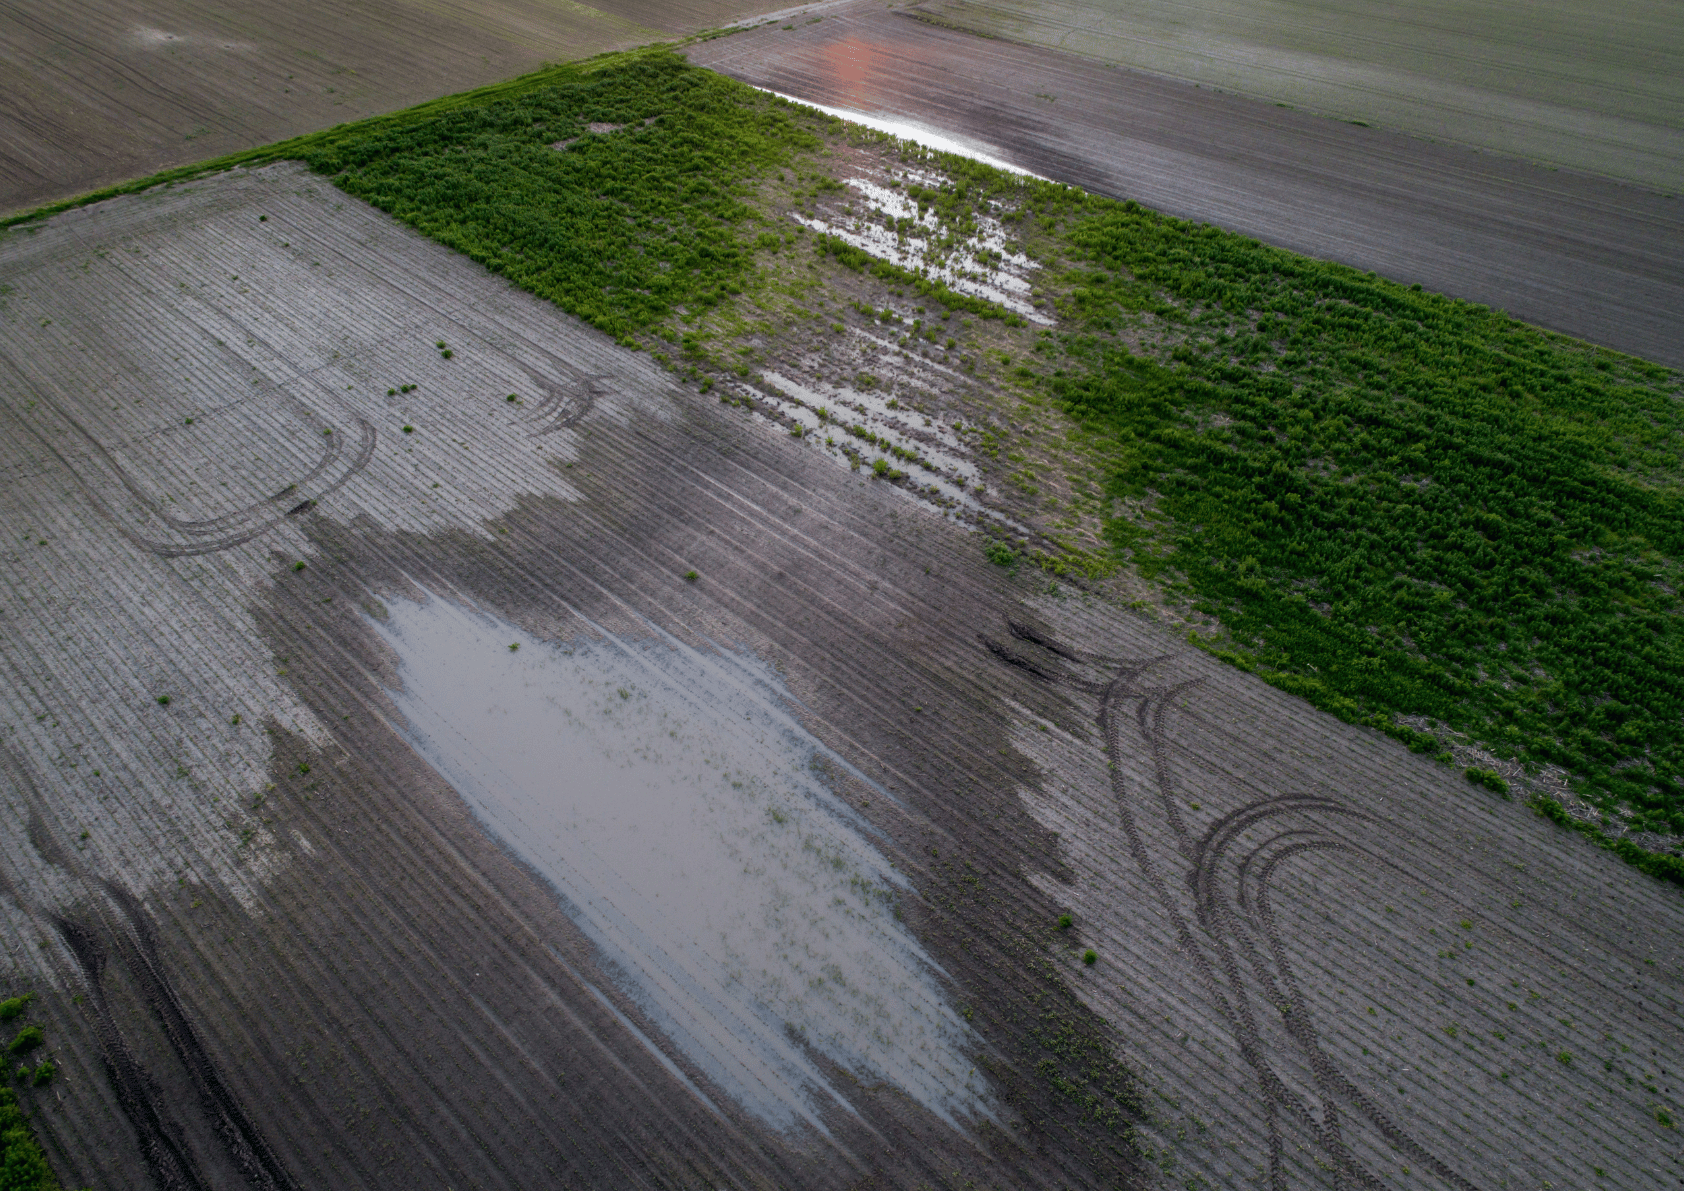
Know where floods, drought and extreme weather are likely to hit, before you plan crops, lend or insure. We assess climate risk parcel by parcel for farms, banks and insurers, from satellite archives, public hydrology data and climate projections, and deliver it as maps and a PDF report within 2–4 weeks, with yearly updates.

Per parcel
risk assessed parcel by parcel
3 risks
flood, drought and extreme weather
2–4 weeks
to the risk report
Yearly
re-run as the climate data changes
One year of risk on one farm

Climate pressure, parcel by parcel

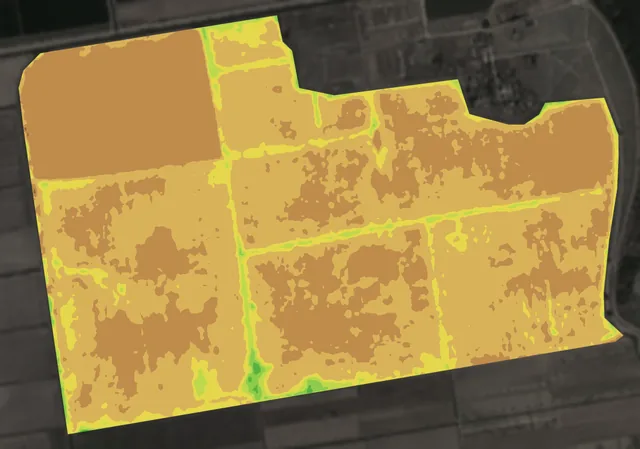
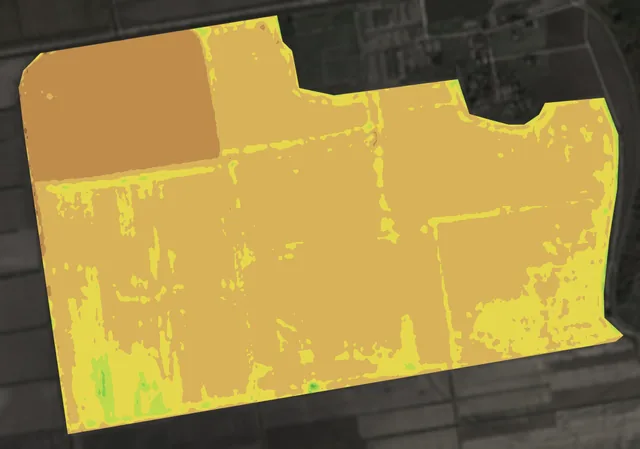
The same 320 hectares in the Bărăgan plain, 2025, from satellite and weather records. A climate-risk report looks at many years this way, for every parcel.

  1. 1

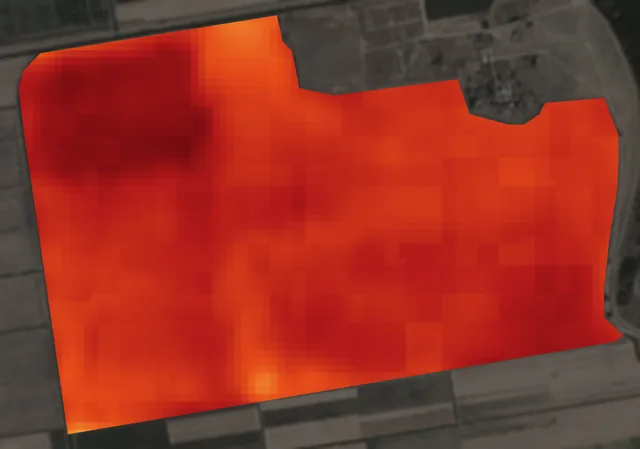
    Some parcels run hotter

    On 14 July, a heatwave day, the fields’ surface ranged from 49 °C on field B to 54 °C on field A, harvested and bare.

    Four degrees apart on one farm, under the same sun.

    What you do: See which parcels heat up most when a heatwave comes.

    40 °C56 °C
  2. 2

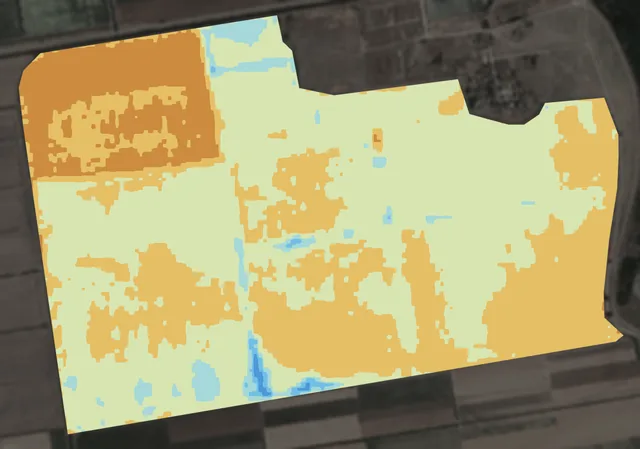
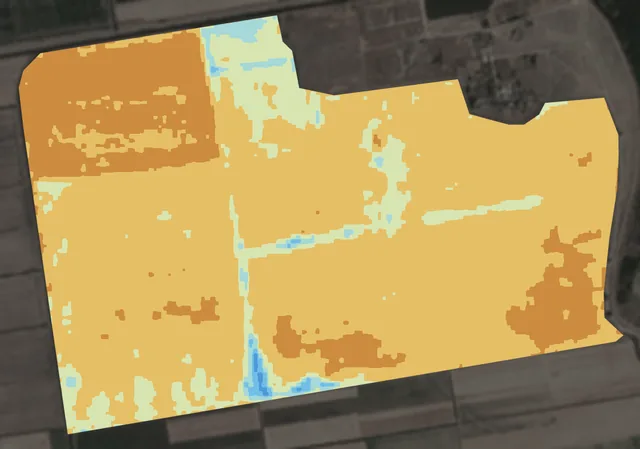
    Some parcels dry out sooner

    Fields E and F went into water stress on 2 July, C and D on 12 July, and B only on 1 August.

    Almost a month apart on one farm, in the same weather.

    What you do: Know which parcels carry the drought risk before you plan crops, lend or insure.

    severe stressenough water
  3. 3

    How long the dry spells lasted

    Two long dry spells in one season: 30 days from 29 May to 27 June, and 43 days from 30 July to 10 September, with no day above 2 mm of rain.

    By mid-August the spring crops had dried out.

    What you do: Measure the dry spells your parcels actually get, year after year.

    rain a day (30 mm and more drawn at the top)highest temperature, 0–40 °Ca day the alert would have gone out
    bare soildense crop
  4. 4

    And the extremes, in a single year

    Frost down to −1.1 °C on 8 April, gusts of 68 km/h on 10 April, and 73 mm of rain in 24 hours on 7–8 October.

    Each would have set off one of the app’s weather alerts. A risk report counts how often they come back.

    What you do: Judge a parcel’s risk on what happens on that parcel, not on a county average.

    rain a day (30 mm and more drawn at the top)highest temperature, 0–40 °Ca day the alert would have gone out
    bare soildense crop

Weather: ERA5 reanalysis at the farm’s coordinates (Open-Meteo historical archive). Alerts: the app’s own rules and default thresholds applied to what happened; in the app they run on the forecast, a day or two ahead. Maps from 2025 Sentinel-2 and Landsat 9 images. Contains modified Copernicus Sentinel data 2025. Landsat: USGS.

What you get

Everything you need to make field decisions based on data — not assumptions. Features included in this solution:

  • / 01

    Flood-risk mapping (historical events + projections)

  • / 02

    Drought-stress analysis (NDMI, NDVI multi-year)

  • / 03

    Extreme-weather frequency analysis

  • / 04

    Crop-specific stress vulnerability scoring

  • / 05

    Insurance and lending portfolio risk reports

  • / 06

    CMIP6 climate projection integration

How it works

How it works, step by step, from the first message to the result.

  1. 1

    Define your scope

    Single farm, portfolio or region.

  2. 2

    We assemble the data

    Satellite archive, hydrology, climate models.

  3. 3

    Risk report delivered

    Spatial PDF + GIS datasets, 2–4 weeks turnaround.

  4. 4

    Annual updates available

    Re-run as climate data evolves.

Frequently asked

  • Is this a self-service tool or a consulting service?
    Climate-risk analysis is delivered as a consulting service — we scope the project with you, assemble the data and deliver a custom report. The underlying datasets and analysis are not exposed as a self-serve feature in the platform.
  • How accurate are climate projections at parcel level?
    Climate models (CMIP6) operate at coarse resolution (~25–100 km). We downscale projections using local topography and historical observations to produce farm-relevant outputs, but uncertainty bounds are always disclosed in our reports.

Ready to start?

Try it on your own parcels, or tell us what you need — we reply within one business day.